

Characterization of gene expression profiles for different types of mast cells pooled from mouse stomach subregions by an RNA amplification method
- PMID: 19154611
- PMCID: PMC2639374
- DOI: 10.1186/1471-2164-10-35
Characterization of gene expression profiles for different types of mast cells pooled from mouse stomach subregions by an RNA amplification method
Abstract
Background: Mast cells (MCs) play pivotal roles in allergy and innate immunity and consist of heterogenous subclasses. However, the molecular basis determining the different characteristics of these multiple MC subclasses remains unclear.
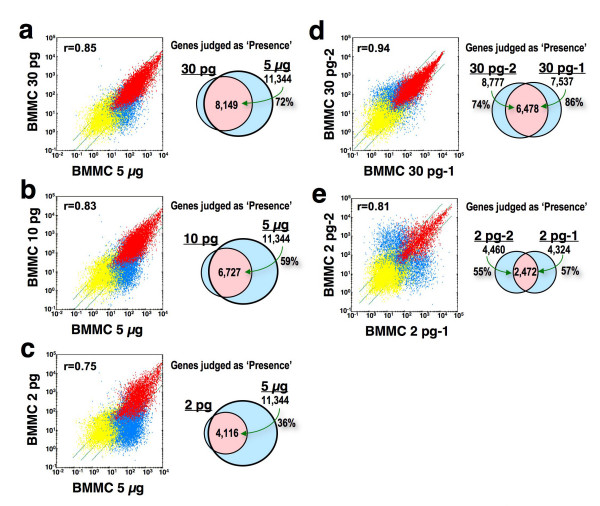
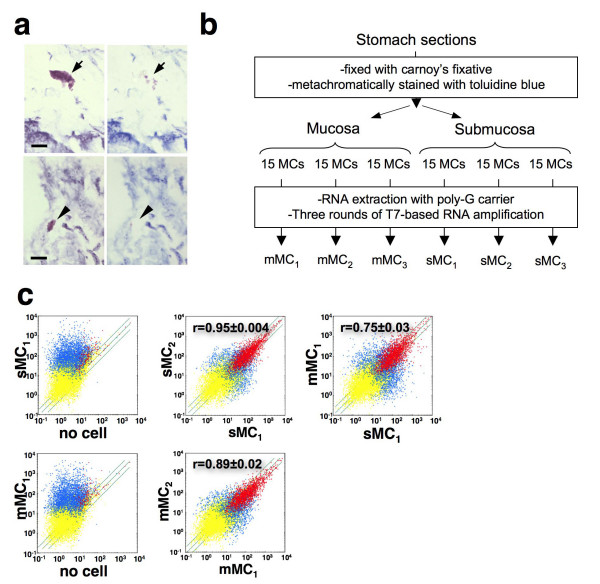
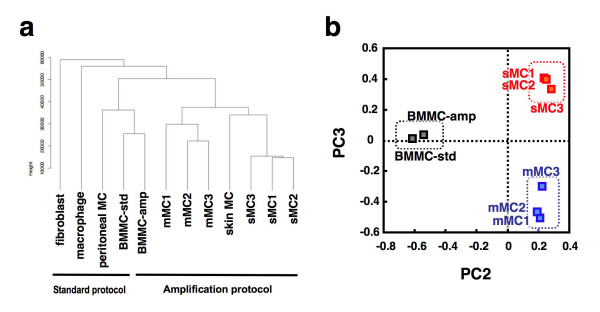
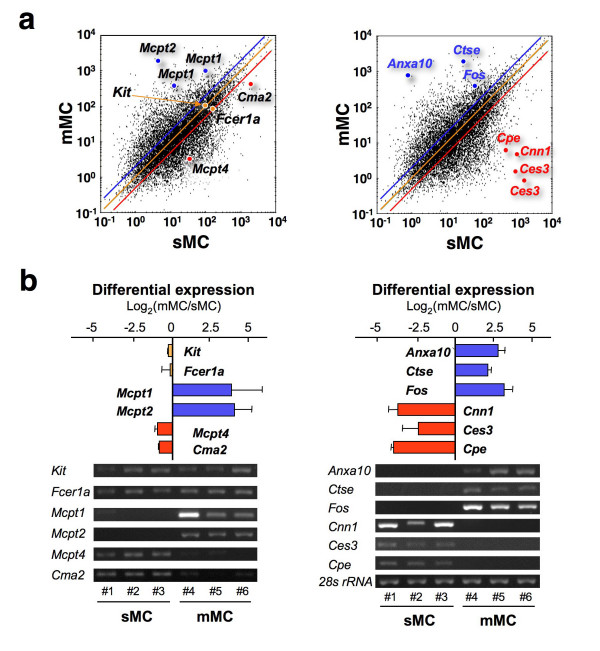
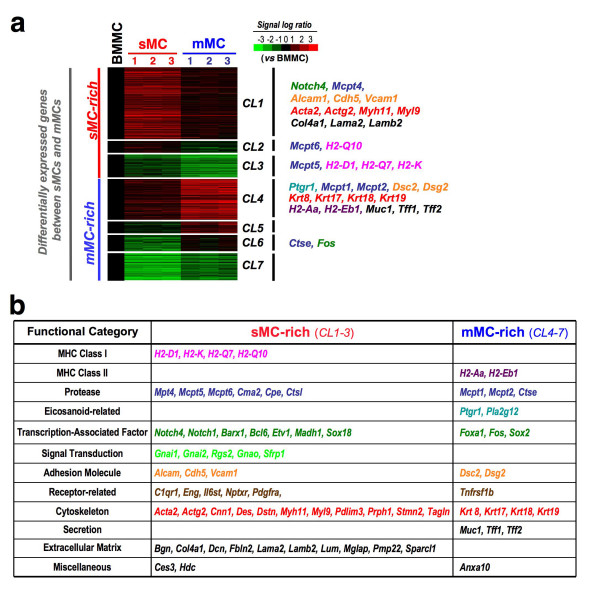
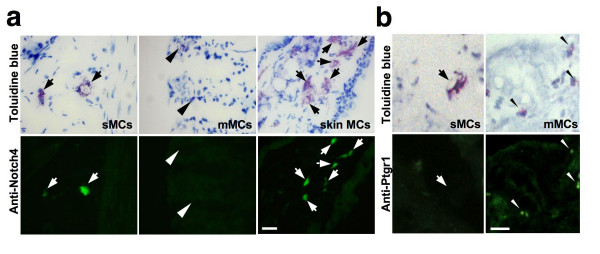
Results: To approach this, we developed a method of RNA extraction/amplification for intact in vivo MCs pooled from frozen tissue sections, which enabled us to obtain the global gene expression pattern of pooled MCs belonging to the same subclass. MCs were isolated from the submucosa (sMCs) and mucosa (mMCs) of mouse stomach sections, respectively, 15 cells were pooled, and their RNA was extracted, amplified and subjected to microarray analysis. Known marker genes specific for mMCs and sMCs showed expected expression trends, indicating accuracy of the analysis. We identified 1,272 genes showing significantly different expression levels between sMCs and mMCs, and classified them into clusters on the basis of similarity of their expression profiles compared with bone marrow-derived MCs, which are the cultured MCs with so-called 'immature' properties. Among them, we found that several key genes such as Notch4 had sMC-biased expression and Ptgr1 had mMC-biased expression. Furthermore, there is a difference in the expression of several genes including extracellular matrix protein components, adhesion molecules, and cytoskeletal proteins between the two MC subclasses, which may reflect functional adaptation of each MC to the mucosal or submucosal environment in the stomach.
Conclusion: By using the method of RNA amplification from pooled intact MCs, we characterized the distinct gene expression profiles of sMCs and mMCs in the mouse stomach. Our findings offer insight into possible unidentified properties specific for each MC subclass.
Figures
Similar articles
-
Gene expression profiling of human mast cell subtypes: an in silico study.Allergol Int. 2006 Jun;55(2):173-9. doi: 10.2332/allergolint.55.173. Allergol Int. 2006. PMID: 17075254
-
Quantitative In-Depth Analysis of the Mouse Mast Cell Transcriptome Reveals Organ-Specific Mast Cell Heterogeneity.Cells. 2020 Jan 14;9(1):211. doi: 10.3390/cells9010211. Cells. 2020. PMID: 31947690 Free PMC article.
-
The role of galanin in the differentiation of mucosal mast cells in mice.Eur J Immunol. 2020 Jan;50(1):110-118. doi: 10.1002/eji.201848061. Epub 2019 Nov 19. Eur J Immunol. 2020. PMID: 31706262
-
Mast Cell-Mediated Orchestration of the Immune Responses in Human Allergic Asthma: Current Insights.Clin Rev Allergy Immunol. 2019 Apr;56(2):234-247. doi: 10.1007/s12016-018-8720-1. Clin Rev Allergy Immunol. 2019. PMID: 30506113 Review.
-
Transcriptome amplification methods in gene expression profiling.Expert Rev Mol Diagn. 2006 May;6(3):465-80. doi: 10.1586/14737159.6.3.465. Expert Rev Mol Diagn. 2006. PMID: 16706747 Review.
Cited by
-
Establishment and Characterization of a Murine Mucosal Mast Cell Culture Model.Int J Mol Sci. 2019 Dec 29;21(1):236. doi: 10.3390/ijms21010236. Int J Mol Sci. 2019. PMID: 31905768 Free PMC article.
-
Comparative gene expression profiles in pancreatic islets associated with agouti yellow mutation and PACAP overexpression in mice.Biochem Biophys Rep. 2015 Jun 24;2:179-183. doi: 10.1016/j.bbrep.2015.06.006. eCollection 2015 Jul. Biochem Biophys Rep. 2015. PMID: 29124161 Free PMC article.
-
Notch1-mediated signaling induces MHC class II expression through activation of class II transactivator promoter III in mast cells.J Biol Chem. 2011 Apr 8;286(14):12042-8. doi: 10.1074/jbc.M110.138966. Epub 2011 Feb 14. J Biol Chem. 2011. PMID: 21321116 Free PMC article.
-
GEM-TREND: a web tool for gene expression data mining toward relevant network discovery.BMC Genomics. 2009 Sep 3;10:411. doi: 10.1186/1471-2164-10-411. BMC Genomics. 2009. PMID: 19728865 Free PMC article.
References
-
- Metcalfe DD, Baram D, Mekori YA. Mast cells. Physiol Rev. 1997;77:1033–1079. - PubMed
-
- Ogasawara T, Murakami M, Suzuki-Nishimura T, Uchida MK, Kudo I. Mouse bone marrow-derived mast cells undergo exocytosis, prostanoid generation, and cytokine expression in response to G protein-activating polybasic compounds after coculture with fibroblasts in the presence of c-kit ligand. J Immunol. 1997;158:393–404. - PubMed
-
- Hernandez-Hansen V, Bard JD, Tarleton CA, Wilder JA, Lowell CA, Wilson BS, Oliver JM. Increased expression of genes linked to FcepsilonRI Signaling and to cytokine and chemokine production in Lyn-deficient mast cells. J Immunol. 2005;175:7880–7888. - PubMed
Publication types
MeSH terms
Substances
LinkOut - more resources
Full Text Sources
