

Mining social mixing patterns for infectious disease models based on a two-day population survey in Belgium
- PMID: 19154612
- PMCID: PMC2656518
- DOI: 10.1186/1471-2334-9-5
Mining social mixing patterns for infectious disease models based on a two-day population survey in Belgium
Abstract
Background: Until recently, mathematical models of person to person infectious diseases transmission had to make assumptions on transmissions enabled by personal contacts by estimating the so-called WAIFW-matrix. In order to better inform such estimates, a population based contact survey has been carried out in Belgium over the period March-May 2006. In contrast to other European surveys conducted simultaneously, each respondent recorded contacts over two days. Special attention was given to holiday periods, and respondents with large numbers of professional contacts.
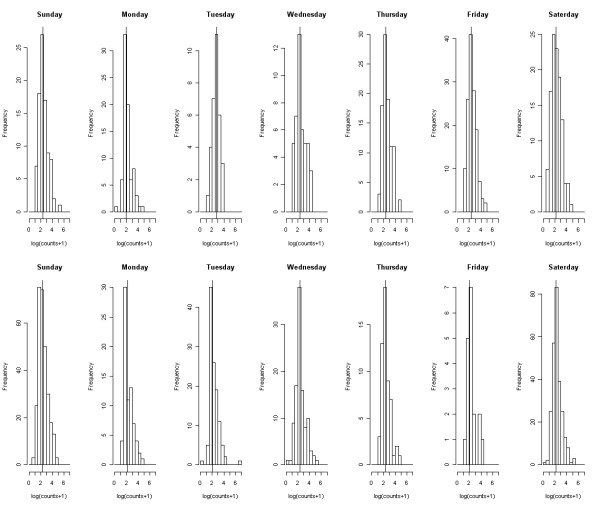
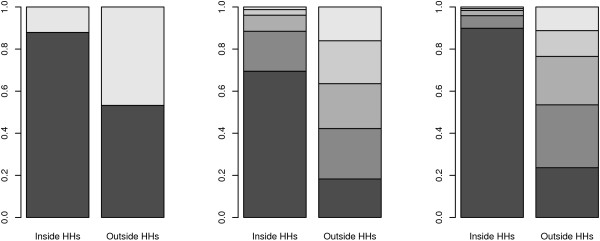
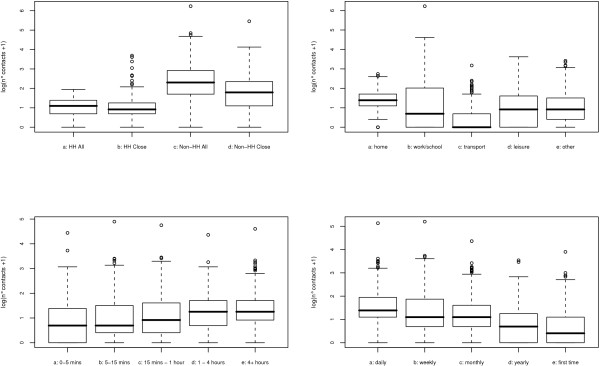
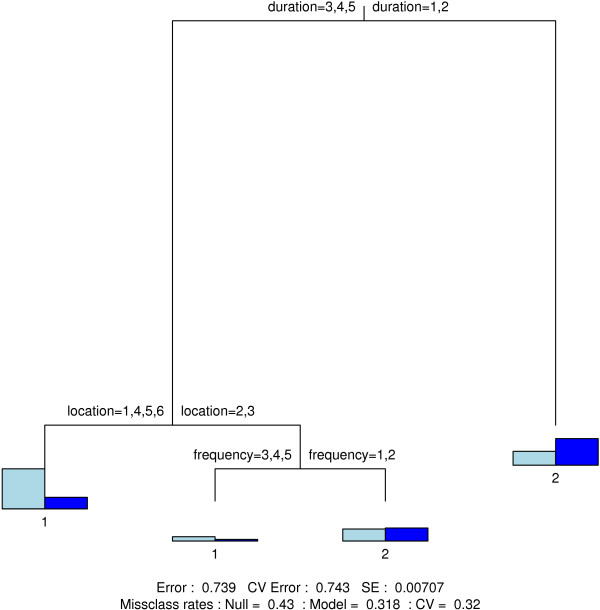
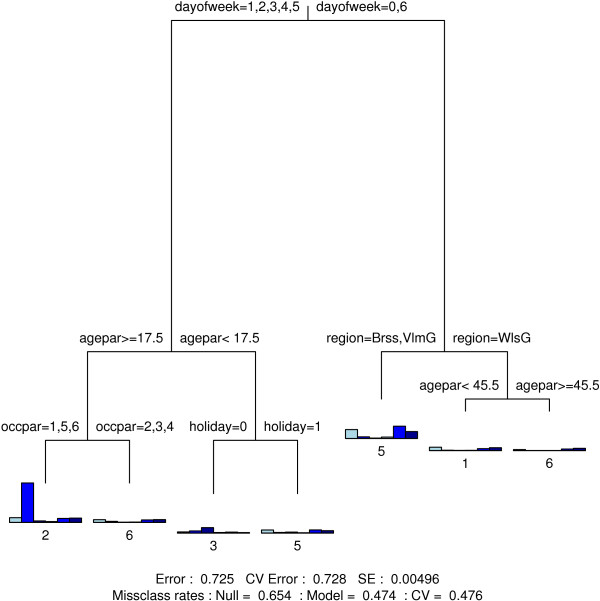
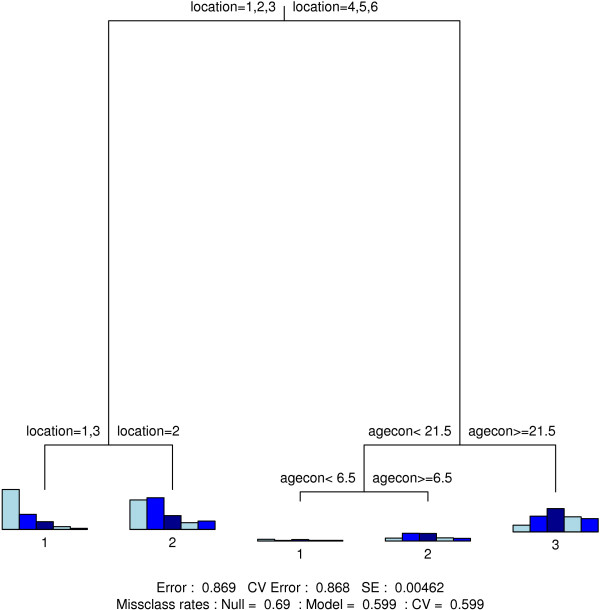
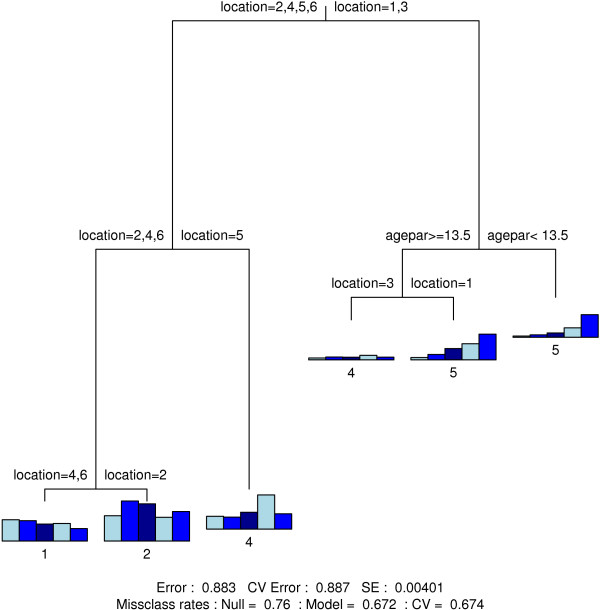
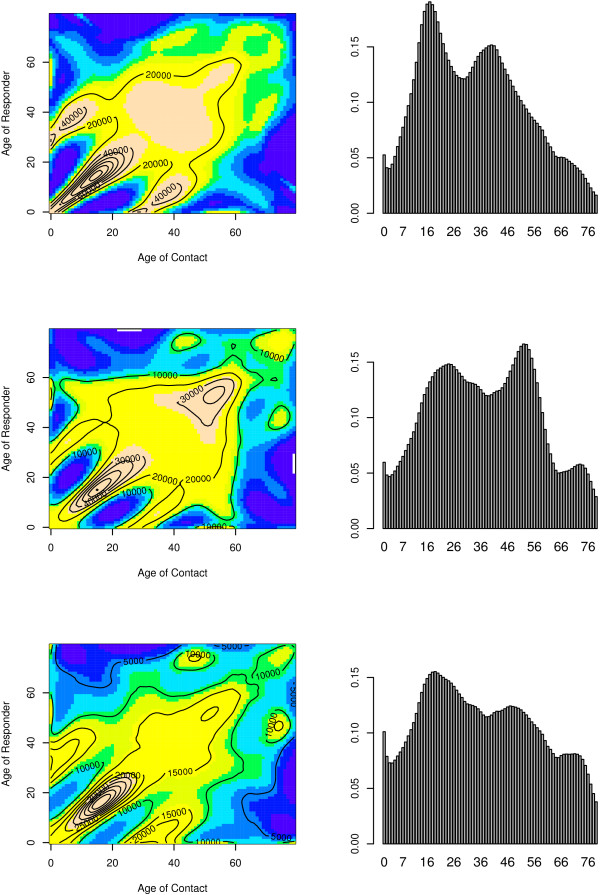
Methods: Participants kept a paper diary with information on their contacts over two different days. A contact was defined as a two-way conversation of at least three words in each others proximity. The contact information included the age of the contact, gender, location, duration, frequency, and whether or not touching was involved. For data analysis, we used association rules and classification trees. Weighted generalized estimating equations were used to analyze contact frequency while accounting for the correlation between contacts reported on the two different days. A contact surface, expressing the average number of contacts between persons of different ages was obtained by a bivariate smoothing approach and the relation to the so-called next-generation matrix was established.
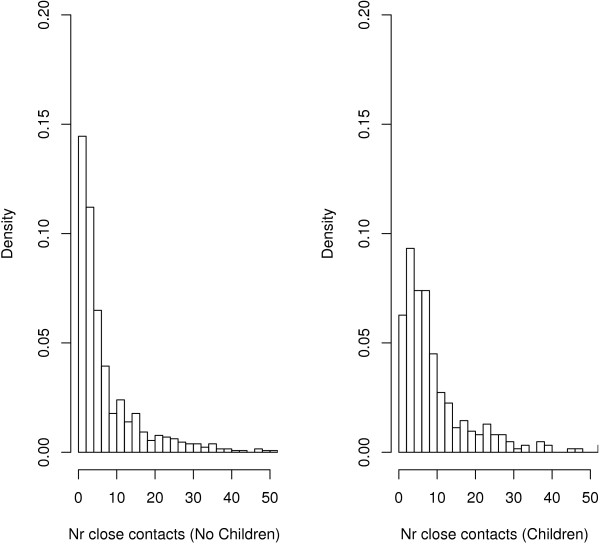
Results: People mostly mixed with people of similar age, or with their offspring, their parents and their grandparents. By imputing professional contacts, the average number of daily contacts increased from 11.84 to 15.70. The number of reported contacts depended heavily on the household size, class size for children and number of professional contacts for adults. Adults living with children had on average 2 daily contacts more than adults living without children. In the holiday period, the daily contact frequency for children and adolescents decreased with about 19% while a similar observation is made for adults in the weekend. These findings can be used to estimate the impact of school closure.
Conclusion: We conducted a diary based contact survey in Belgium to gain insights in social interactions relevant to the spread of infectious diseases. The resulting contact patterns are useful to improve estimating crucial parameters for infectious disease transmission models.
Figures
References
-
- Anderson R, May R. Infectious Diseases of Humans: Dynamics and Control. Oxford University Press; 1991.
-
- Farrington C, Whitaker H. Contact surface models for infectious diseases: estimation from serologic survey data. Journal of the American Statistical Association. 2005;100:370–379. doi: 10.1198/016214504000001754. - DOI
Publication types
MeSH terms
LinkOut - more resources
Full Text Sources
Medical
