. 2009 Apr 15;45(3):832-44.
doi: 10.1016/j.neuroimage.2008.12.023. Epub 2008 Dec 25.

Tract-based morphometry for white matter group analysis

Affiliations

Tract-based morphometry for white matter group analysis

Lauren J O'Donnell et al. Neuroimage. .

Abstract

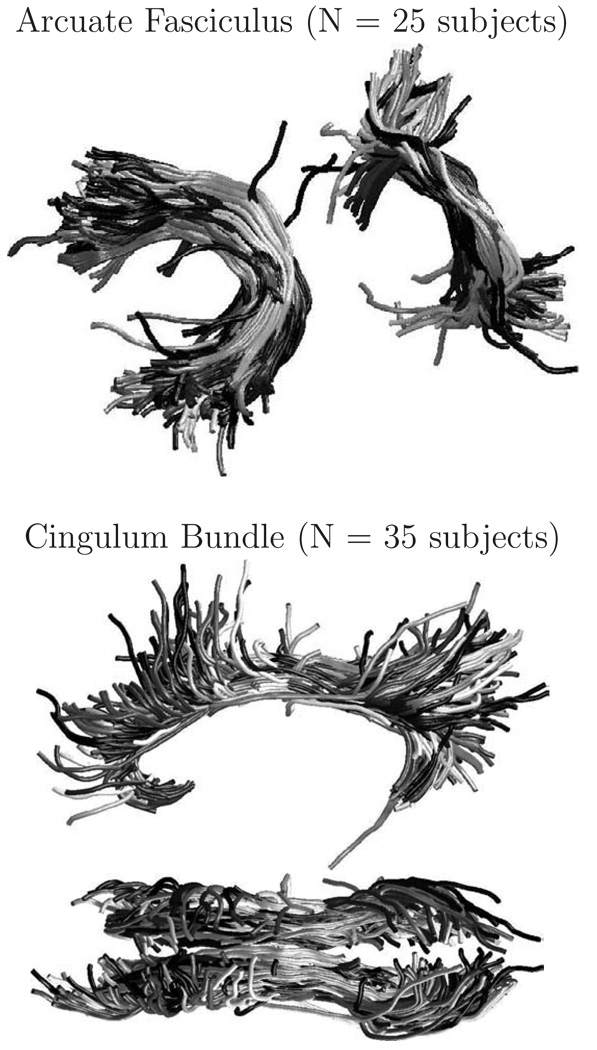
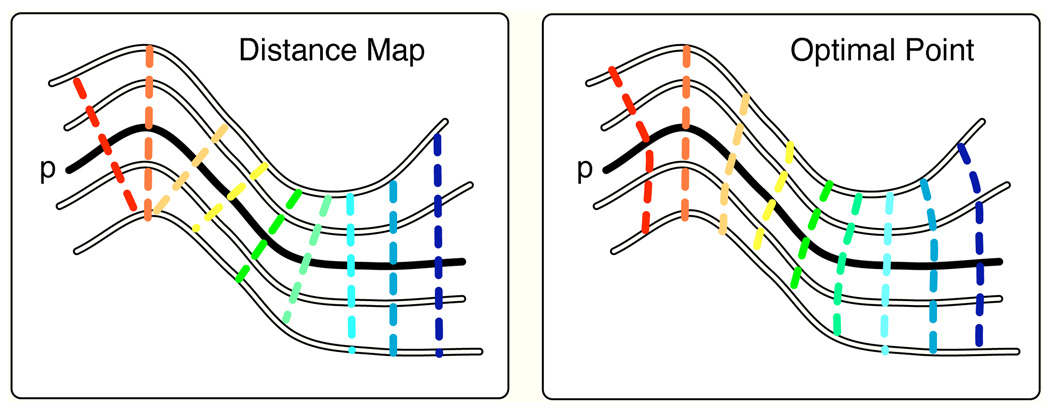
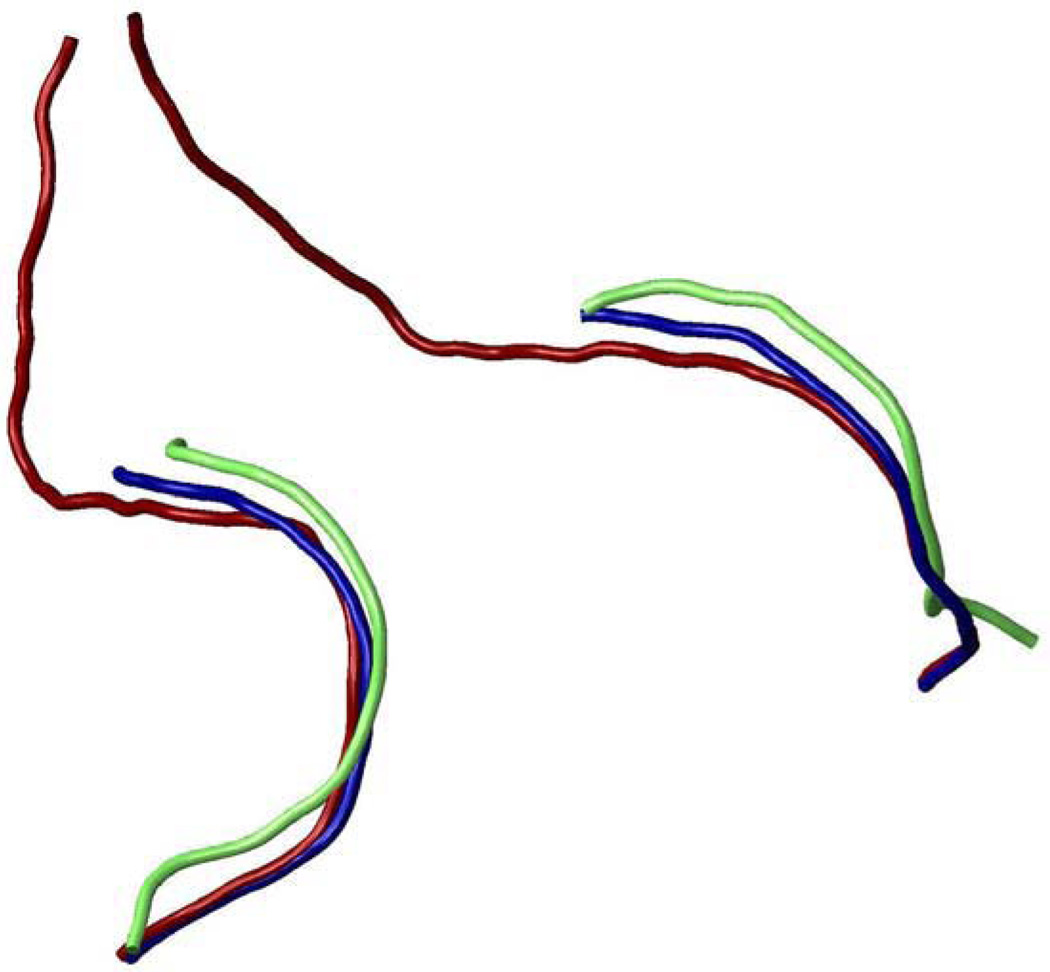
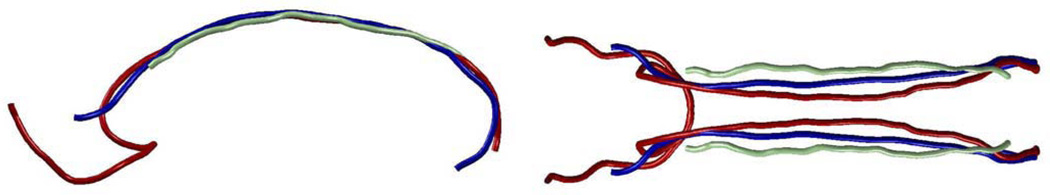
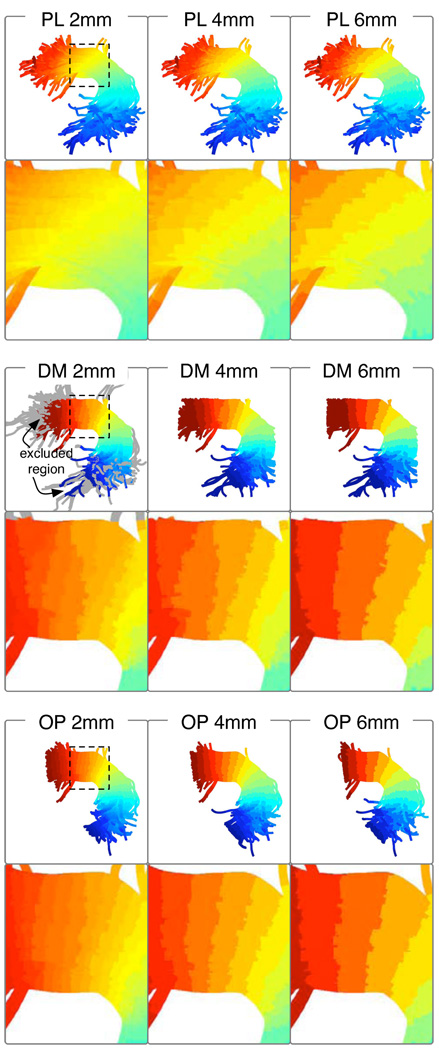
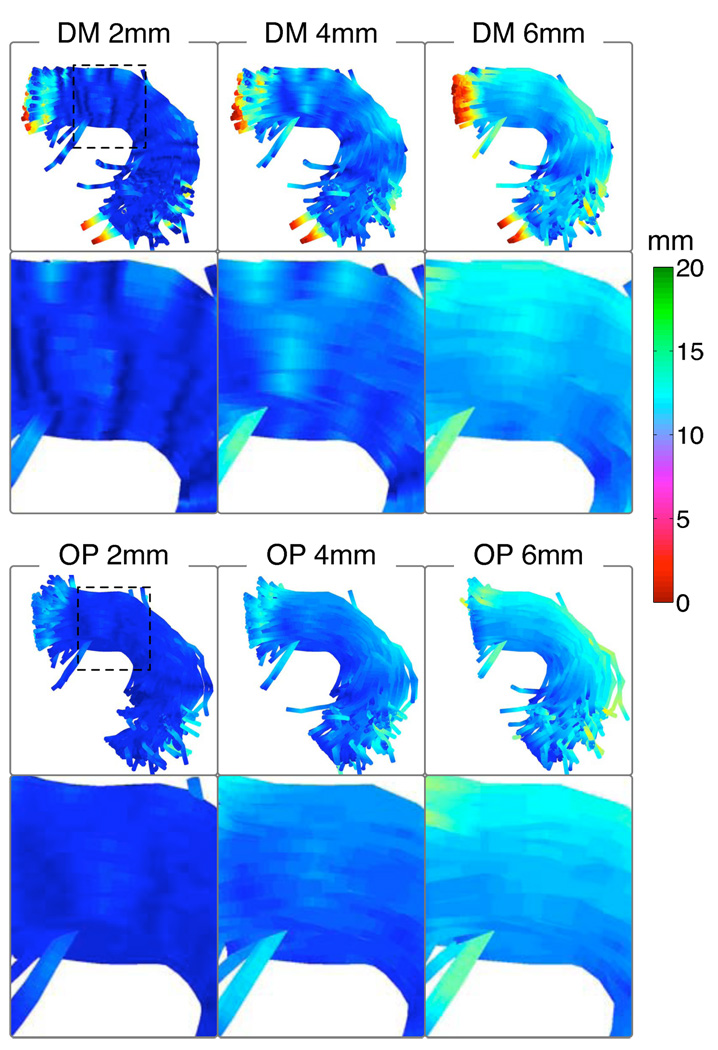
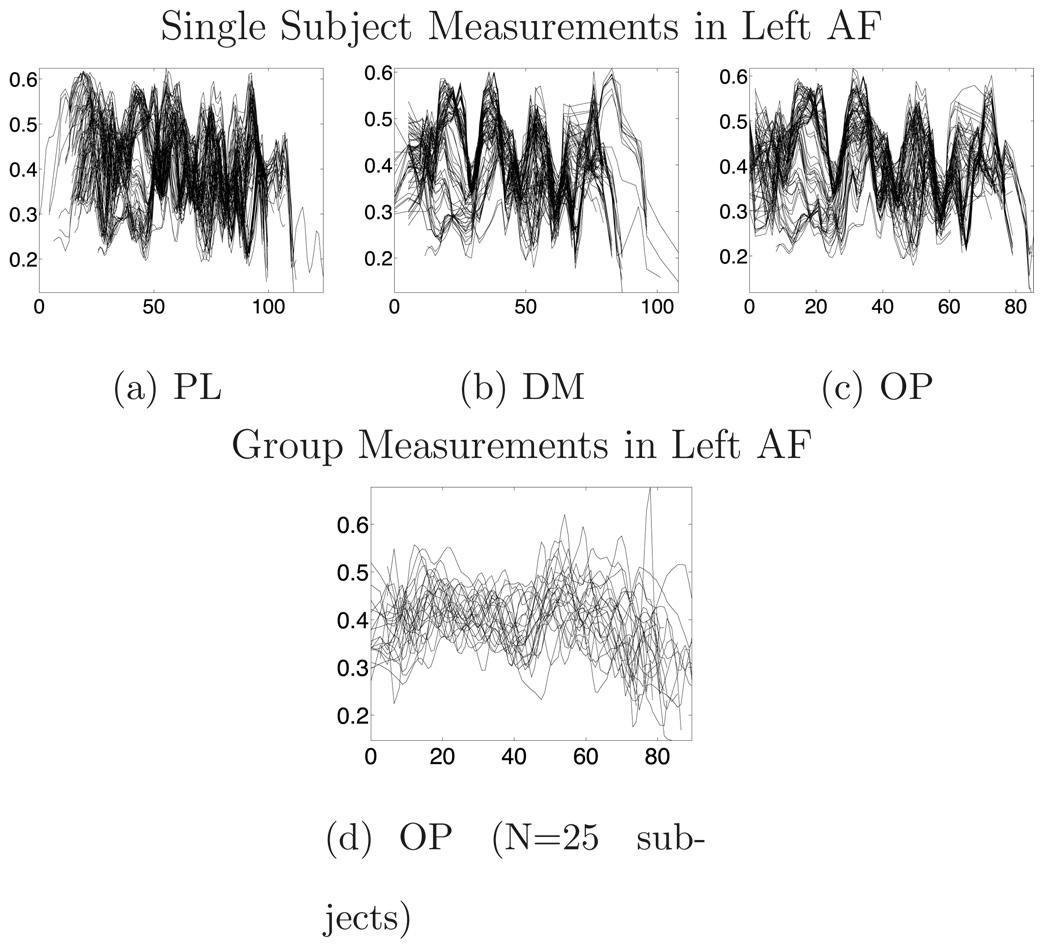
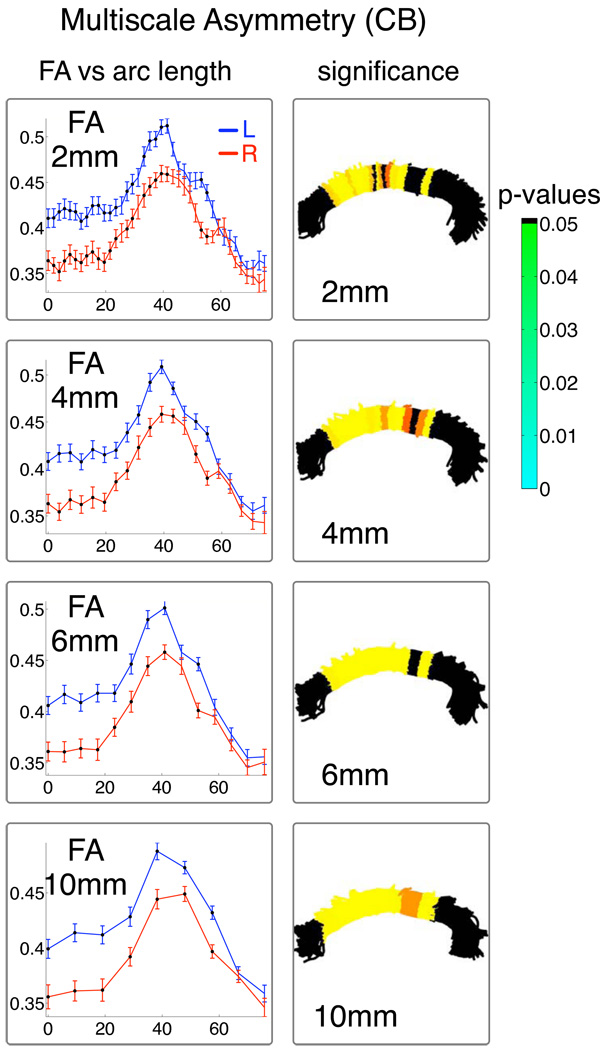
We introduce an automatic method that we call tract-based morphometry, or TBM, for measurement and analysis of diffusion MRI data along white matter fiber tracts. Using subject-specific tractography bundle segmentations, we generate an arc length parameterization of the bundle with point correspondences across all fibers and all subjects, allowing tract-based measurement and analysis. In this paper we present a quantitative comparison of fiber coordinate systems from the literature and we introduce an improved optimal match method that reduces spatial distortion and improves intra- and inter-subject variability of FA measurements. We propose a method for generating arc length correspondences across hemispheres, enabling a TBM study of interhemispheric diffusion asymmetries in the arcuate fasciculus (AF) and cingulum bundle (CB). The results of this study demonstrate that TBM can detect differences that may not be found by measuring means of scalar invariants in entire tracts, such as the mean diffusivity (MD) differences found in AF. We report TBM results of higher fractional anisotropy (FA) in the left hemisphere in AF (caused primarily by lower lambda(3), the smallest eigenvalue of the diffusion tensor, in the left AF), and higher left hemisphere FA in CB (related to higher lambda(1), the largest eigenvalue of the diffusion tensor, in the left CB). By mapping the significance levels onto the tractography trajectories for each structure, we demonstrate the anatomical locations of the interhemispheric differences. The TBM approach brings analysis of DTI data into the clinically and neuroanatomically relevant framework of the tract anatomy.


Figures

Fig. 1
Fig. 1
Input multisubject fiber bundles in regions of the arcuate fasciculus (top) and cingulum (bottom). A random sample of 25 fibers is shown from each subject. Shades of gray indicate subject numbers. The bundles were automatically segmented from whole brain tractography data.
Fig. 2
Fig. 2
Illustration of the difference between matching perpendicular to the prototype in the distance map method (left) and allowing near-perpendicular matches in the optimal point match method (right). The bold trajectory (p) is the prototype fiber. The dashed lines, representing arc length assignments, connect points on the prototype to their matches on other fibers. Here the optimal point method better handles curvature of the prototype and fibers.
Fig. 3
Fig. 3
Symmetric bilateral prototype fibers generated from multisubject arcuate fasciculus fiber bundles using three methods: longest (red), fiber-density-weighted longest (blue), and embedding (light green). View is from left and slightly posterior.
Fig. 4
Fig. 4
Symmetric bilateral prototype fibers generated from multisubject cingulum fiber bundles using three methods: longest (red), fiber-density-weighted longest (blue), and embedding (light green). Views are from left (on left) and above (on right).
Fig. 5
Fig. 5
Arc length parameterizations (Section 2.4) in color in AF, in the entire bundle and in a zoomed region (dashed square). A sample of fibers from all subjects is shown. In gray, the leftmost DM image gives an example of regions that were excluded during matching (due to the Euclidean distance threshold and to restricted matching past the prototype endpoint). Note the PL method does not respect the curved tract geometry, and the DM method produces unexpected results at lower size scales.
Fig. 6
Fig. 6
Distortion measure LengthMS (Section 2.4.6), the length of the input fiber that was mapped to each output arc length, in AF. A sample of fibers from all subjects is shown. To avoid any bias due to distortion, LengthMS should vary as little as possible across all subjects and fibers, for each size scale. For example at the 2mm size scale, ideally the color should be a solid dark blue, indicating LengthMS of 2mm everywhere (see colorbar). Generally the OP method produces less distortion: less variation is seen in the LengthMS color.
Fig. 7
Fig. 7
Arc length parameterizations (Section 2.4) in color in CB, in the entire bundle and in a zoomed region (dashed square). A sample of fibers from all subjects is shown. In gray, the leftmost DM image gives an example of regions that were excluded during matching. Note that PL is less spatially consistent, and DM is adversely affected by prototype curvature at lower size scales. As fibers leave the structure and before they are truncated, OP is more likely to increment the arc length than DM, leading to subtle differences at 6mm.
Fig. 8
Fig. 8
LengthMS (Section 2.4.6), the length of the input fiber that was mapped to each output arc length. To avoid any bias due to distortion, the color should vary as little as possible across all subjects and fibers, for each size scale. Generally the OP method produces less distortion: less variation is seen in the LengthMS color. used with a discretization of 4mm, the Euclidean distance threshold from the prototype was set to 20mm for AF and 10mm for CB, and the OP (optimal point matching) method was employed for arc length parameterization.
Fig. 9
Fig. 9
Example FA measurements vs. arc length from a single subject and the group, for all methods, in the left arcuate fasciculus at 1mm discretization. In (a–c), each curve gives the measurements from one fiber, while in (d) each curve is the average measurement across one subject’s fibers.
Fig. 10
Fig. 10
Example FA measurements vs. arc length from a single subject and the group, for all methods, in the left cingulum bundle at 1mm discretization. In (a–c), each curve gives the measurements from one fiber, while in (d) each curve is the average measurement across one subject’s fibers.
Fig. 11
Fig. 11
Output mean fibers are highly similar regardless of method or spatial scale. Mean fibers for AF (top) and CB (bottom) were generated using OP, DM, and PL methods, for all discretizations of the fiber-density weighted longest prototype. The left column shows all mean fibers including regions where some subjects contributed no data; the right column shows only the region common across all subjects. The mean fibers in this common region are very similar across methods. The common region results are not very sensitive to the shape of the prototype as the PL method (red-orange fibers) used the prototype only to define the arc length origin.
Fig. 12
Fig. 12
Within-subject variability of FA, compared across methods (cutting plane or PL, distance map or DM, and optimal point match or OP) and size scales (of prototype fiber, shown along x-axis). The quantity plotted is the coefficient of variation computed for each subject (as the variance across all subject fibers of pointwise subject FA divided by pointwise subject mean FA), then averaged across subjects and along the fiber.
Fig. 13
Fig. 13
Within-group variability of FA, compared across methods (cutting plane or PL, distance map or DM, and optimal point match or OP) and size scales (of prototype fiber, shown along x-axis). Each data point represents the average along the fiber of the pointwise group coefficient of variation (FA variance in the group divided by group mean FA).
Fig. 14
Fig. 14
Spatial resolution vs. statistical significance tradeoff: repetition of inter-hemispheric FA analysis at several scales in AF. For each arc length coordinate, each subject’s mean FA was computed for the left and right bundles. The (group) mean and standard error of these per-subject means is shown vs. arc length in mm (left column). The multiple comparison corrected p-value for significant difference is overlaid on a sample of fibers from the group (right column).
Fig. 15
Fig. 15
Spatial resolution vs. statistical significance tradeoff: repetition of inter-hemispheric FA analysis at several scales in CB. For each arc length coordinate, each subject’s mean FA was computed for the left and right bundles. The (group) mean and standard error of these per-subject means is shown vs. arc length in mm (left column). The multiple comparison corrected p-value for significant difference is overlaid on a sample of fibers from the group (right column)..
Fig. 16
Fig. 16
Left and right hemisphere measurements in the group, and their significant differences, in the arcuate fasciculus. For each arc length coordinate, each subject’s mean MD, λ1, λ2, and λ3 values were computed for the left and right bundles. The (group) mean and standard error of these per-subject means is shown vs. arc length in mm (left column). The multiple comparison corrected p-value for significant difference is overlaid on a sample of fibers from the group (right column).
Fig. 17
Fig. 17
Left and right hemisphere measurements in the group, and their significant differences, in the cingulum bundle. For each arc length coordinate, each subject’s mean MD, λ1, λ2, and λ3 values were computed for the left and right bundles. The (group) mean and standard error of these per-subject means is shown vs. arc length in mm (left column). The multiple comparison corrected p-value for significant difference is overlaid on a sample of fibers from the group (right column).

References

    1. Ashburner J, Friston K. Voxel-based morphometry-the methods. NeuroImage. 2000;11(6):805–821. - PubMed
    1. Basser P, Pajevic S, Pierpaoli C, Duda J, Aldroubi A. In vivo fiber tractography using DT-MRI data. Magnetic Resonance in Medicine. 2000;44:625–632. - PubMed
    1. Batchelor PG, Calamante F, Tournier J-D, Atkinson D, Hill DLG, Connelly A. Quantification of the shape of fiber tracts. Magnetic Resonance in Medicine. 2006;55(4) - PubMed
    1. Buchel C, Raedler T, Sommer M, Sach M, Weiller C, Koch M. White Matter Asymmetry in the Human Brain: A Diffusion Tensor MRI Study. Cereb. Cortex. 2004;14(9):945–951. - PubMed
    1. Corouge I, Fletcher P, Joshi S, Gouttard S, Gerig G. Fiber tractoriented statistics for quantitative diffusion tensor MRI analysis. Medical Image Analysis. 2006;10(5):786–798. - PubMed

Publication types

MeSH terms