. 2009 Apr 1;18(7):1353-67.
doi: 10.1093/hmg/ddp036. Epub 2009 Jan 19.

Deficiency of the E3 ubiquitin ligase TRIM32 in mice leads to a myopathy with a neurogenic component

Affiliations

Deficiency of the E3 ubiquitin ligase TRIM32 in mice leads to a myopathy with a neurogenic component

Elena Kudryashova et al. Hum Mol Genet. .

Abstract

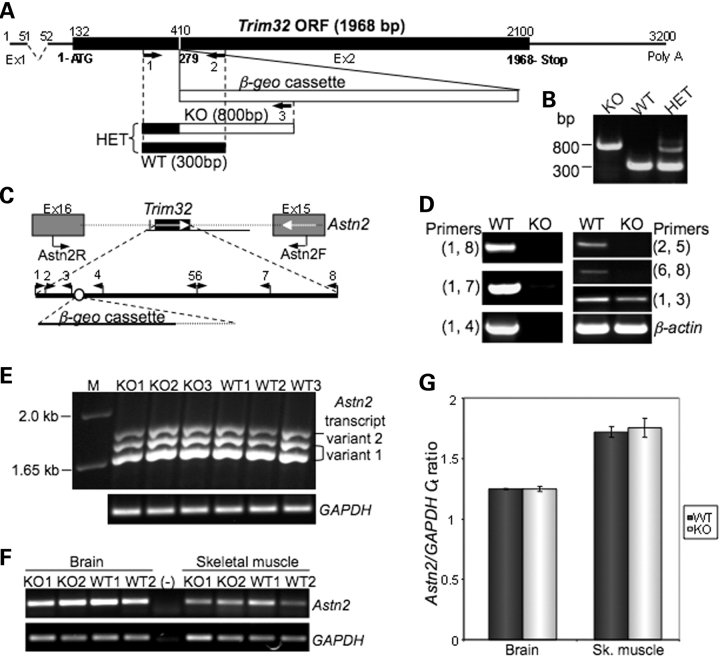
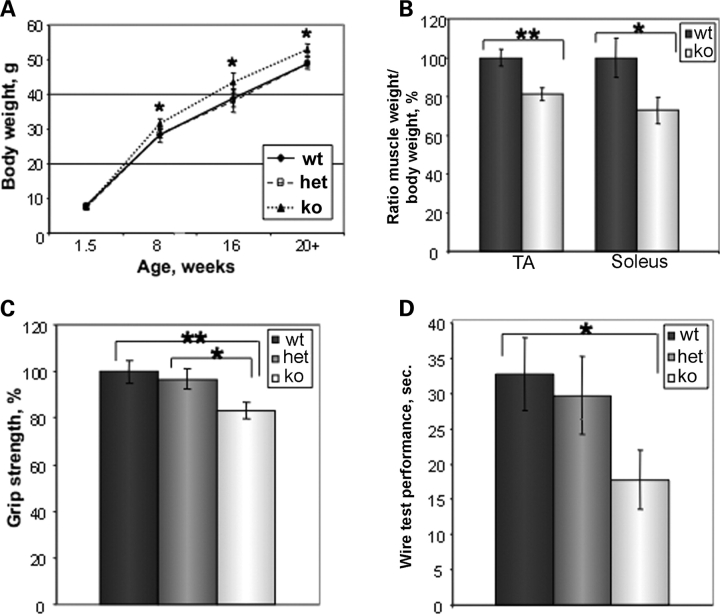
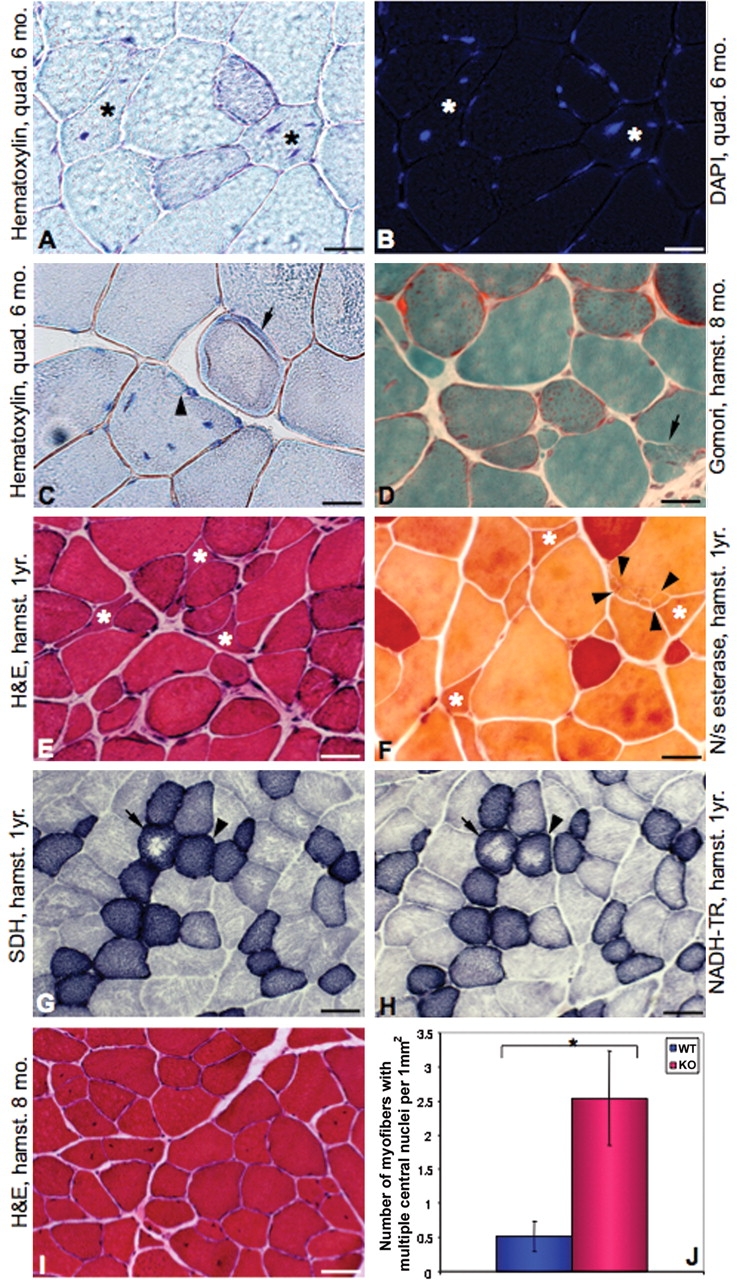
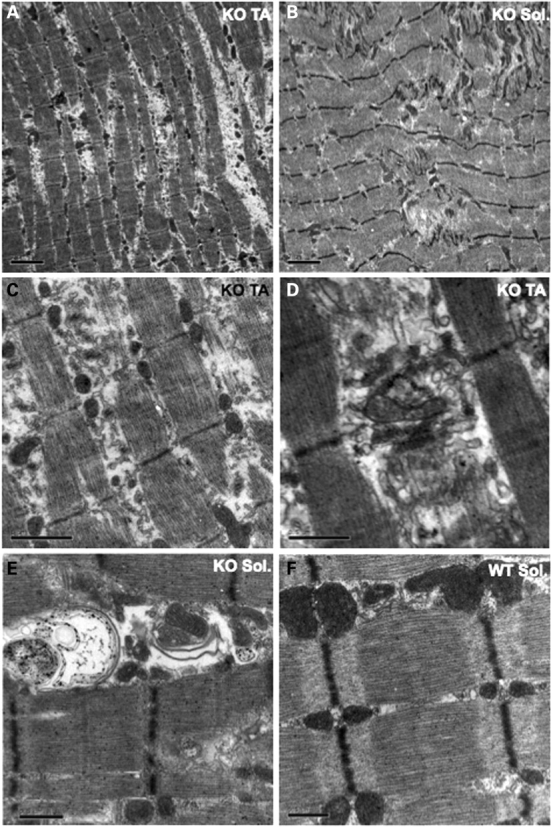
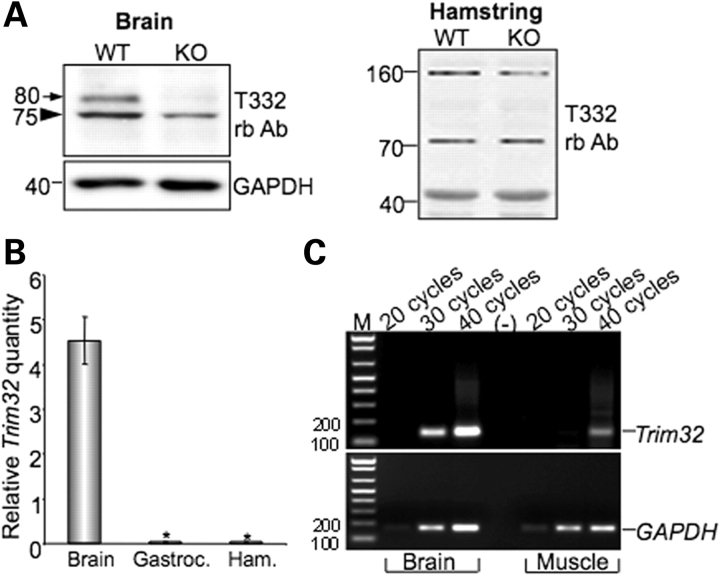
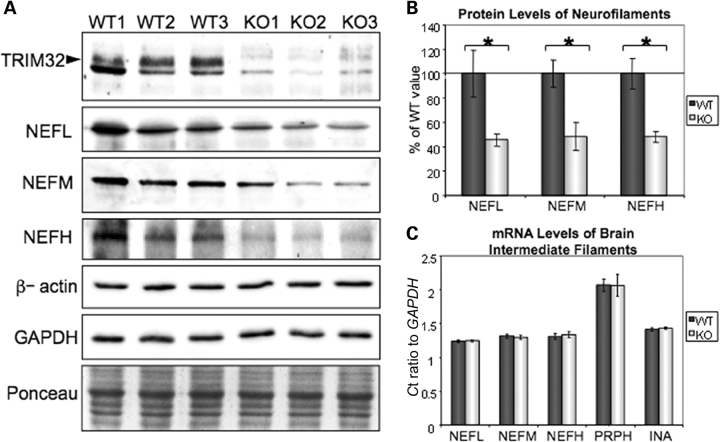
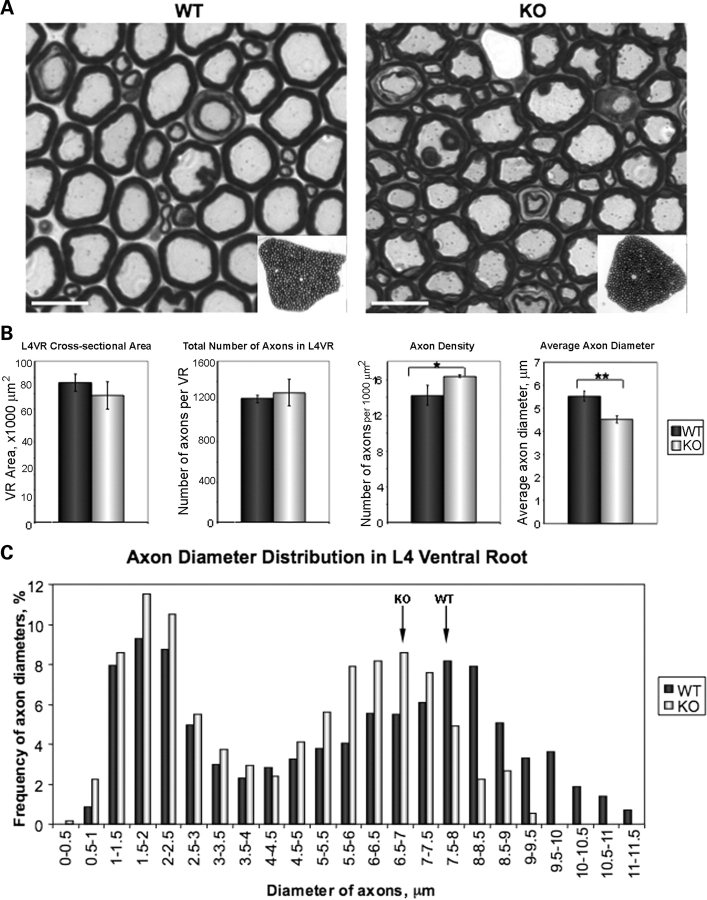
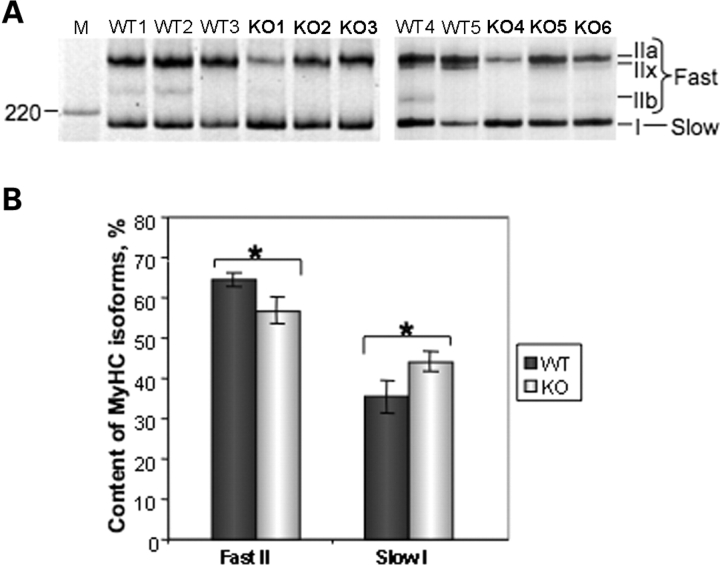
Limb-girdle muscular dystrophy type 2H (LGMD2H) and sarcotubular myopathy are hereditary skeletal muscle disorders caused by mutations in TRIM32. We previously identified TRIM32 as an E3 ubiquitin ligase that binds to myosin and ubiquitinates actin. To date four TRIM32 mutations have been linked to LGMD2H, all of which occur in the C-terminal NHL domains. Unexpectedly, a fifth mutation in the B-box of TRIM32 causes a completely different, multisystemic disorder, Bardet-Biedl syndrome type 11. It is not understood how allelic mutations in TRIM32 can create such diverse phenotypic outcomes. To generate a tool for elucidating the complex in vivo functions of TRIM32, we created the first murine Trim32 knock-out model (T32KO). Histological analysis of T32KO skeletal muscles revealed mild myopathic changes. Electron microscopy showed areas with Z-line streaming and a dilated sarcotubular system with vacuoles -- the latter being a prominent feature of sarcotubular myopathy. Therefore, our model replicates phenotypes of LGMD2H and sarcotubular myopathy. The level of Trim32 expression in normal mouse brain exceeds that observed in skeletal muscle by more than 100 times, as we demonstrated by real-time PCR. Intriguingly, analysis of T32KO neural tissue revealed a decreased concentration of neurofilaments and a reduction in myelinated motoraxon diameters. The axonal changes suggest a shift toward a slower motor unit type. Not surprisingly, T32KO soleus muscle expressed an elevated type I slow myosin isotype with a concomitant reduction in the type II fast myosin. These data suggest that muscular dystrophy due to TRIM32 mutations involves both neurogenic and myogenic characteristics.


Figures

Figure 1.
Figure 1.
Generation of Trim32-null mice. (A) Schematic of the Trim32 gene with integrated β-geo cassette. Integration site was verified by sequencing. (B) Genotyping PCR for the presence of gene trap insertion using three genotyping primers (shown by numbered arrows in A) results in production of an 800 bp band in KO, amplified from the allele with the integrated β-geo cassette (primers 1 and 3) and 300 bp band from the WT allele (primers 1 and 2). PCR from HET containing both alleles (primers 1, 2 and 3) yields both bands. (C) Schematic structure of Trim32 genetic locus on mouse chromosome 4. Mouse Trim32 gene lies within the intron flanked by exons 16 and 15 of Astn2 gene, which runs in the opposite direction. (D) RT–PCR analysis demonstrates the disruption of Trim32 after the gene trap insertion. Primers used for this analysis are represented by triangles on the map shown on (C). Trim32 PCR products are absent in T32KO, except for its most 5′ end fragment preceding the integration site of β-geo cassette. β-Actin PCR is used as cDNA control. (E) RT–PCR followed by sequencing of the products obtained after amplification from both WT and T32KO brain cDNA confirmed the preserved expression of Astn2 transcript variants 1 (GenBank accession number NM_019514) and 2 (GenBank accession number NM_207109) in T32KO. Primers Astn2Fex3 and Astn2Rex16 flank the alternatively spliced region of the Astn2 gene (exon 3 through exon 16). Lane (M): 1 kb plus DNA ladder (Invitrogen). GAPDH PCR is used as cDNA control. (F) and (G) The levels of Astn2 expression are not changed in T32KO brain and skeletal muscle as demonstrated by real-time PCR using Astn2F and Astn2R primers indicated as arrows on (C). PCR data from two representative samples for each genotype are shown on (F). Lane (–) is a negative control in which no DNA was added into the PCR. GAPDH PCR is used as cDNA control. Real-time PCR data are shown in graph (G) as average cycle threshold (Ct) for Astn2 normalized by Ct for GAPDH detected in samples from three WT and three KO animals.
Figure 2.
Figure 2.
Muscle performance is impaired in T32KO. (A) Comparison of body weight gain in T32KO and WT mice. Average body weight in grams ± SEM was calculated for males of each genotype and plotted as a function of age. Average body weight was ∼10% higher in T32KO after 8 weeks of age, compared with age-matched WT or HET (n = 5–15, *P < 0.05). (B) The ratio of muscle weight to body weight was calculated and expressed as the percent of WT value ± SEM for fast TA and slow (soleus) muscles. T32KO muscle weight normalized to body weight was reduced by 19 and 27% for TA and soleus muscles, respectively (n = 15, **P = 0.002, *P = 0.03). (C) Forelimb grip strength of KO (n = 21), WT (n = 26) and HET (n = 25) animals was measured using grip strength meter and expressed as percent of WT value ± SEM. Age of the tested animals: 5–9 months. Grip strength of T32KO mice was reduced by 17%, compared with WT or HET littermates (**P < 0.01 and *P < 0.05). (D) Wire hang test performance. Latency to fall was compared within genotypes as average time in seconds ± SEM, n = 11–16, age 5–9 months. Latency to fall was 1.8 times less in T32KO animals, compared with WT (*P < 0.05).
Figure 3.
Figure 3.
Histology of T32KO muscles. Micrographs of cross-sections of T32KO muscles. Type of muscles (quad.: quadriceps and hamstr.: hamstring group of muscles) and age of animals are specified on the micrographs. (A and B) Serial sections stained with hematoxylin (A) or DAPI (B) show internalized nuclei. Asterisks indicate fibers with multiple nuclei displaced from the periphery to the center. Scale bar is 10 µm. (C) Hematoxylin staining shows ring-fiber (arrow) and fiber splitting (arrowhead). Note mislocalized nuclei. Scale bar is 10 µm. (D) Modified Gomori trichrome staining. Arrow points to a splitting fiber. Scale bar is 10 µm. (E) Hematoxylin and eosin staining. Note fiber diameter variability and small angulated fibers (asterisks). Scale bar is 20 µm. (F) Non-specific esterase staining. Angulated fibers (asterisks) are not stained darkly in this enzymatic reaction suggesting that they are not denervated. Arrows indicate an area of the fiber that is fragmented. Scale bar is 10 µm. (G and H) Serial sections stained for SDH (G) and NADH-TR (H) enzymatic activity. Arrows point to fibers with central pallor, indicating defects in both mitochondrial and SR staining. Arrowheads indicate a fiber with a defect in SR only since SDH (mitochondrial) staining is normal. Scale bar is 40 µm. (I) Hematoxylin and eosin staining, scale bar is 40 µm. (J) Number of myofibers containing two or more centrally located nuclei was quantified in cross-sections of hamstring group of muscles from three WT and three T32KO animals (*P < 0.05).
Figure 4.
Figure 4.
Electron microscopy of T32KO skeletal muscles. (AE) Electron micrographs represent T32KO muscles (TA and solei as indicated on the figure). Note increased intermyofibrillar spaces (A) and Z-line streaming with myofibrillar degeneration and disorganized sarcomeres (B). Higher magnification shows membranous structures, dilated sarcotubular system (C, D) and autophagic double-membraned vacuoles (E). Scale bars are 2 µm for (A) and (B), 1 µm for (C) and 0.5 µm for (D) and (E). (F) Normal sarcomeric organization of WT skeletal muscle. Scale bar is 0.5 µm.
Figure 5.
Figure 5.
TRIM32 expression in brain and skeletal muscle. (A) Western blot analysis of brain and skeletal muscle (hamstring) lysates using T332 antibody. The 80 kDa band in brain lysate is absent in T32KO, but the 72 kDa band in muscle persists in the T32KO. Anti-GAPDH staining is shown for loading control. (B) Real-time PCR data as Trim32 relative quantity normalized to GAPDH demonstrate a greater than 100-fold difference in Trim32 expression between brain and skeletal muscles (gastroc.: gastrocnemius and ham.: hamstring groups of muscles). Samples from three different WT animals were analyzed. Each sample was run in triplicate for both Trim32 and GAPDH amplifications, *P < 0.05. (C) Regular PCR using real-time PCR primers and different number of cycles is shown to visualize the real-time PCR data. Trim32 PCR band in muscles is detected only after 40 cycles of amplification, whereas in brain it can be observed after 30 cycles. GAPDH PCR used as a control shows approximately equal amount of cDNA in brain and muscle samples. M: markers (DNA ladder). Lane (–) is a negative control in which no DNA was added into the PCR.
Figure 6.
Figure 6.
Neurofilament protein concentrations are reduced in T32KO brains. (A) Western blots of T32KO brain lysates using NEFL, NEFM and NEFH-specific antibodies. GAPDH, β-actin and Ponceau S staining is shown for loading control. TRIM32 staining using T332 antibody demonstrates an 80 kDa TRIM32 band (arrowhead) in WT brain lysates, which is absent in T32KO. (B) Quantification of the blots shown in (A). Average intensity of the bands is expressed as a percent of the WT value ± SEM (n = 3, *P < 0.05). (C) Relative mRNA levels of intermediate filaments are not changed in KO brains, compared with WT, as revealed by real-time PCR. NEFL: neurofilament light polypeptide; NEFM: neurofilament medium polypeptide; NEFH: neurofilament heavy polypeptide; PRPH: peripherin and INA: α-internexin.
Figure 7.
Figure 7.
Diameters of myelinated axons are reduced in T32KO. (A) Semi-thin sections of L4 VRs from WT and KO stained with toluidine blue. L4 VRs were dissected from three WT and three KO, 8.5-month-old animals. Representative micrographs are shown. Scale bar is 10 µm. Insets show low magnification images of the sections. (B) Comparison of morphometric data from KO and WT L4 VRs. Cross-sectional area of L4 VRs is represented as the mean for each genotype ± SEM. Total number of axons in L4 VRs was calculated using VR cross-sectional area and number of axons per 1000 µm2. Axon density was calculated as the number of axons per 1000 µm2. T32KO axonal density is increased by 15%, compared with WT (*P < 0.05). Average axon diameter of T32KO is reduces by 22%, compared with WT (**P < 0.0001). (C) Histogram shows axon diameter distribution in L4 VR. Axon diameters were measured in three random areas of VR containing a total of 200–240 axons. The number of axons with certain diameter was expressed as the percent of total number of axons measured in each sample (three KO and three WT). Note that the peak corresponding to large diameter axons is shifted to the left in T32KO, compared with WT (arrows). Axons with diameter more than 9.5 µm were not observed in T32KO L4 VR.
Figure 8.
Figure 8.
Decreased axonal diameter in T32KO is associated with a shift in fiber-type-specific MYHC isoforms. (A) MYHC isoform gel electrophoresis of soleus muscle lysates. Positions of individual MYHC isoforms are indicated. Five WT and six KO muscles were analyzed. M: Benchmark protein ladder (Invitrogen). (B) Quantification of the gels shown in (A). The fraction corresponding to individual MYHC isoforms were calculated as a percent of total MYHC content ± SEM in each sample. This accounted for the differences in loading. MYHC isoforms IIa and IIx co-migrate, and therefore were quantified together. Amount of MYHC type II (fast) is decreased and amount of MYHC type I (slow) is increased in T32KO soleus muscle by ∼8%, compared with WT (*P < 0.05).

References

    1. Reymond A., Meroni G., Fantozzi A., Merla G., Cairo S., Luzi L., Riganelli D., Zanaria E., Messali S., Cainarca S., et al. The tripartite motif family identifies cell compartments. EMBO J. 2001;20:2140–2151. - PMC - PubMed
    1. Kudryashova E., Kudryashov D., Kramerova I., Spencer M.J. Trim32 is a ubiquitin ligase mutated in limb girdle muscular dystrophy type 2H that binds to skeletal muscle myosin and ubiquitinates actin. J. Mol. Biol. 2005;354:413–424. - PubMed
    1. Albor A., El-Hizawi S., Horn E.J., Laederich M., Frosk P., Wrogemann K., Kulesz-Martin M. The interaction of Piasy with Trim32, an E3-ubiquitin ligase mutated in limb-girdle muscular dystrophy type 2H, promotes Piasy degradation and regulates UVB-induced keratinocyte apoptosis through NFκB. J. Biol. Chem. 2006;281:25850–25866. - PubMed
    1. Kano S., Miyajima N., Fukuda S., Hatakeyama S. Tripartite motif protein 32 facilitates cell growth and migration via degradation of Abl-interactor 2. Cancer Res. 2008;68:5572–5580. - PubMed
    1. Pickart C.M., Eddins M.J. Ubiquitin: structures, functions, mechanisms. Biochim. Biophys. Acta. 2004;1695:55–72. - PubMed

Publication types

MeSH terms