

doi: 10.1093/nar/gkp006.
Epub 2009 Jan 20.
Real-time single-molecule observation of rolling-circle DNA replication
Affiliations
- PMID: 19155275
- PMCID: PMC2651787
- DOI: 10.1093/nar/gkp006
Item in Clipboard
Real-time single-molecule observation of rolling-circle DNA replication
Nucleic Acids Res.
2009 Mar.
Abstract
We present a simple technique for visualizing replication of individual DNA molecules in real time. By attaching a rolling-circle substrate to a TIRF microscope-mounted flow chamber, we are able to monitor the progression of single-DNA synthesis events and accurately measure rates and processivities of single T7 and Escherichia coli replisomes as they replicate DNA. This method allows for rapid and precise characterization of the kinetics of DNA synthesis and the effects of replication inhibitors.
Figures
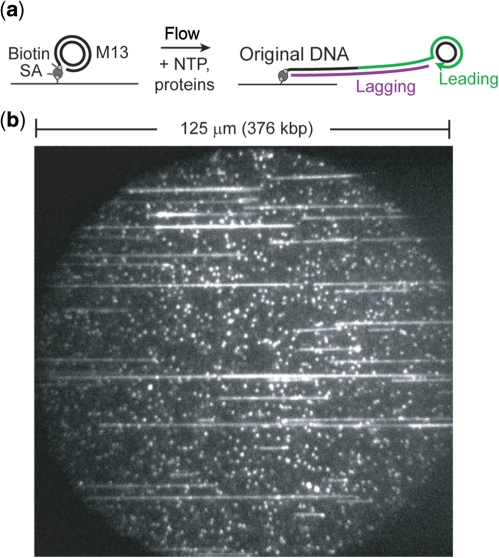
(a) Schematic of single-molecule rolling-circle assay. ‘SA’, streptavidin. Upon leading-strand synthesis, DNA is displaced from the circle as the replisome ‘rolls’ around the template. The emerging ‘tail’ is converted to dsDNA via lagging-strand synthesis. As a result, the DNA that couples the M13 circle to the surface increases in length and is extended in the direction of flow. (b) Example field of view. Note both the length and number of products. Each flow cell has thousands of such fields, allowing for large numbers of products to be observed in a single experiment.
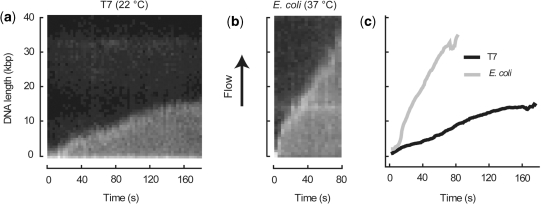
Kymographs of example DNA molecules from (a) T7 and (b) E. coli replication experiments. Endpoint trajectories are plotted vs. time to obtain rates of synthesis by fitting with linear regression (c). Rates of shown traces are: 99.4 bp s−1 (T7) and 467.1 bp s−1 (E. coli).
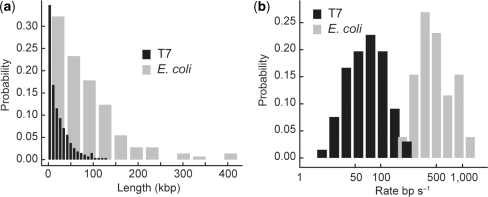
(a) Length distributions of replication products, with means of 25.3 ± 1.7 kbp (T7) and 85.3 ± 6.1 kbp (E. coli). (b) Rate distributions of single molecules, with means of 75.9 ± 4.8 bp s−1 (T7) and 535.5 ± 39 bp s−1 (E. coli). The log of the rates are plotted to allow simultaneous display of both broad distributions.
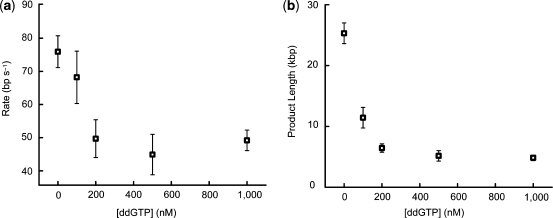
(a) Rates of T7 DNA synthesis at various ddGTP concentrations. (b) Lengths of T7 replication products at various ddGTP concentrations. Values are means and error bars represent standard error of the mean.
Similar articles
-
Bypass of a nick by the replisome of bacteriophage T7.J Biol Chem. 2011 Aug 12;286(32):28488-97. doi: 10.1074/jbc.M111.252023. Epub 2011 Jun 23. J Biol Chem. 2011. PMID: 21701044 Free PMC article.
-
Simultaneous single-molecule measurements of phage T7 replisome composition and function reveal the mechanism of polymerase exchange.Proc Natl Acad Sci U S A. 2011 Mar 1;108(9):3584-9. doi: 10.1073/pnas.1018824108. Epub 2011 Jan 18. Proc Natl Acad Sci U S A. 2011. PMID: 21245349 Free PMC article.
-
Dynamics of DNA replication loops reveal temporal control of lagging-strand synthesis.Nature. 2009 Jan 15;457(7227):336-9. doi: 10.1038/nature07512. Epub 2008 Nov 23. Nature. 2009. PMID: 19029884 Free PMC article.
-
The Replication System of Bacteriophage T7.Enzymes. 2016;39:89-136. doi: 10.1016/bs.enz.2016.02.001. Epub 2016 Mar 28. Enzymes. 2016. PMID: 27241928 Review.
-
Understanding DNA replication by the bacteriophage T4 replisome.J Biol Chem. 2017 Nov 10;292(45):18434-18442. doi: 10.1074/jbc.R117.811208. Epub 2017 Sep 25. J Biol Chem. 2017. PMID: 28972188 Free PMC article. Review.
Cited by
-
Embracing Heterogeneity: Challenging the Paradigm of Replisomes as Deterministic Machines.Chem Rev. 2023 Dec 13;123(23):13419-13440. doi: 10.1021/acs.chemrev.3c00436. Epub 2023 Nov 16. Chem Rev. 2023. PMID: 37971892 Free PMC article. Review.
-
Single-molecule visualization of stalled replication-fork rescue by the Escherichia coli Rep helicase.Nucleic Acids Res. 2023 Apr 24;51(7):3307-3326. doi: 10.1093/nar/gkad186. Nucleic Acids Res. 2023. PMID: 36938885 Free PMC article.
-
The fluorescence properties and binding mechanism of SYTOX green, a bright, low photo-damage DNA intercalating agent.Eur Biophys J. 2015 Jul;44(5):337-48. doi: 10.1007/s00249-015-1027-8. Epub 2015 May 31. Eur Biophys J. 2015. PMID: 26024786
-
Single-molecule insight into stalled replication fork rescue in Escherichia coli.Nucleic Acids Res. 2021 May 7;49(8):4220-4238. doi: 10.1093/nar/gkab142. Nucleic Acids Res. 2021. PMID: 33744948 Free PMC article. Review.
-
DNA Manipulation and Single-Molecule Imaging.Molecules. 2021 Feb 17;26(4):1050. doi: 10.3390/molecules26041050. Molecules. 2021. PMID: 33671359 Free PMC article. Review.
References
-
- Benkovic SJ, Valentine AM, Salinas F. Replisome-mediated DNA replication. Annu. Rev. Biochem. 2001;70:181–208. - PubMed
-
- Johnson A, O’Donnell M. Cellular DNA replicases: components and dynamics at the replication fork. Annu. Rev. Biochem. 2005;74:283–315. - PubMed
-
- Pomerantz RT, O’Donnell M. Replisome mechanics: insights into a twin DNA polymerase machine. Trends Microbiol. 2007;15:156–164. - PubMed
-
- Bell SP, Dutta A. DNA replication in eukaryotic cells. Annu. Rev. Biochem. 2002;71:333–374. - PubMed
-
- Pyle AM. Translocation and unwinding mechanisms of RNA and DNA helicases. Annu. Rev. Biophys. 2008;37:317–336. - PubMed
Publication types
MeSH terms
Substances
Grants and funding
LinkOut - more resources
Full Text Sources
Other Literature Sources
