Review
. 2009 Feb 1;69(3):723-7.
doi: 10.1158/0008-5472.CAN-08-3543. Epub 2009 Jan 20.

Emerging paradigms in cancer genetics: some important findings from high-density single nucleotide polymorphism array studies

Affiliations
Review

Emerging paradigms in cancer genetics: some important findings from high-density single nucleotide polymorphism array studies

Manny D Bacolod et al. Cancer Res. .

Abstract

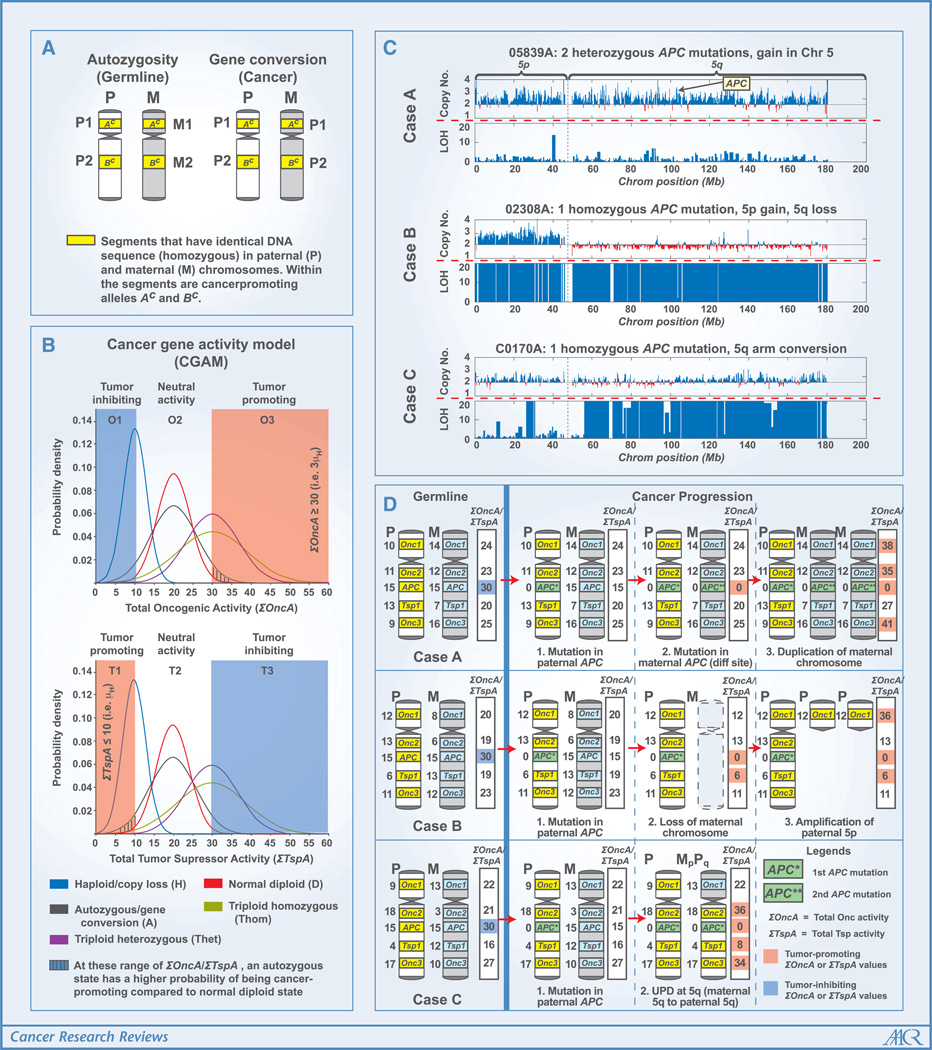
High-density single nucleotide polymorphism (SNP) mapping arrays have identified chromosomal features whose importance to cancer predisposition and progression is not yet clearly defined. Of interest is that the genomes of normal somatic cells (reflecting the combined parental germ-line contributions) often contain long homozygous stretches. These chromosomal segments may be explained by the common ancestry of the individual's parents and thus may also be called autozygous. Several studies link consanguinity to higher rates of cancer, suggesting that autozygosity (a genomic consequence of consanguinity) may be a factor in cancer predisposition. SNP array analysis has also identified chromosomal regions of somatic uniparental disomy (UPD) in cancer genomes. These are chromosomal segments characterized by loss of heterozygosity (LOH) and a normal copy number (two) but which are not autozygous in the germ-line or normal somatic cell genome. In this review, we will also discuss a model [cancer gene activity model (CGAM)] that may explain how autozygosity influences cancer predisposition. CGAM can also explain how the occurrence of certain chromosomal aberrations (copy number gain, LOH, and somatic UPDs) during carcinogenesis may be dependent on the germ-line genotypes of important cancer-related genes (oncogenes and tumor suppressors) found in those chromosomal regions.


Conflict of interest statement

Disclosure of Potential Conflicts of Interest

No potential conflicts of interest were disclosed.

Figures

Figure 1
Figure 1
A, the difference between autozygosity and gene conversion. Both are manifested as long stretches of homozygosity between the homologous chromosomes. Although autozygosity is acquired germinally, gene conversion occurs during carcinogenesis. B, a hypothetical Gaussian distribution of the activity of gene with oncogenic (Onc, upper chart) and tumor suppressor (Tsp) properties. There are 21 possible gene variants for the haploid (H) state (Onc0, Onc1, . . . Onc20 or Tsp0, Tsp1, . . . Tsp20) with oncogenic or tumor suppressor activity ranging from 0 to 20. There are also 212 possible genotypes for the autozygous (A; e.g., Onc1Onc1 and Onc2Onc2) and homozygous triploid (Thom; e.g., Onc1Onc1Onc1 and Onc2Onc2Onc2) states. On the other hand, there are 212 possible genotypes for the normal diploid (D; e.g., Onc1Onc1 and Onc1Onc2) and heterozygous triploid (Thet; e.g., Onc1Onc1Onc1 and Onc1Onc1Onc2) states. This model assumes that for the Onc to be tumor promoting, the total oncogenic activity (Σ OncA) needs to be ≥3 μH (or 30), and for Tsp to be tumor promoting, the total tumor suppressor activity (ΣTspA) needs to be ≤μH (or 10). Although the haploid (H), triploid homozygous (Thom), and triploid heterozygous (Thet) states may refer to copy number variations of Onc and Tsp in germ-line genomes, they may also refer to aberrations in cancer genomes (with haploid similar to a copy loss state, and triploid states similar to gene amplifications). Each probability distribution (H, D, A, Thom, and Thet) is a function of μH and σH. μD = 2 μH, σD=2σH; μA = 2 μH, σA = 2 σH; μThom = 3 μH, σThom = 3 σH; μThet = 3 μH, σThet=5σH. C, chromosome 5 (including APC) profiles of three colon cancer samples. These figures were generated from the SNP array (Affymetrix 50K Xba) data using the Affymetrix Copy Number Analysis Tool (42) and in-house programs. The copy number chart indicates deviations from the normal copy number of 2 (baseline of the chart). High LOH values (for the charts, the LOH value is capped at 20), indicated by tall blue bars, represent segments in the chromosome with contiguous homozygous SNPs. D, theoretical genetic pathways leading to chromosome 5 profiles of the actual colon cancer samples shown in C. Each case starts with a pair of chromosome 5 (P and M) with each Onc or Tsp allele having a defined gene activity (OncA and TspA) ranging from 0 to 20 (APC was assigned a value of 15 in the germ-line state and 0 in the mutated state).

References

    1. Dong S, Wang E, Hsie L, Cao Y, Chen X, Gingeras TR. Flexible use of high-density oligonucleotide arrays for single-nucleotide polymorphism discovery and validation. Genome Res. 2001;11:1418–1424. - PMC - PubMed
    1. Shen R, Fan JB, Campbell D, et al. High-throughput SNP genotyping on universal bead arrays. Mutat Res. 2005;573:70–82. - PubMed
    1. International HapMap Consortium. A haplotype map of the human genome. Nature. 2005;437:1299–1320. - PMC - PubMed
    1. International HapMap Consortium. A second generation human haplotype map of over 3.1 million SNPs. Nature. 2007;449:851–861. - PMC - PubMed
    1. Manolio TA, Brooks LD, Collins FS. A HapMap harvest of insights into the genetics of common disease. J Clin Invest. 2008;118:1590–1605. - PMC - PubMed

Publication types