. 2009 Feb 1;69(3):810-8.
doi: 10.1158/0008-5472.CAN-08-2473. Epub 2009 Jan 20.

A requirement for cyclin-dependent kinase 6 in thymocyte development and tumorigenesis

Affiliations

A requirement for cyclin-dependent kinase 6 in thymocyte development and tumorigenesis

Miaofen G Hu et al. Cancer Res. .

Abstract

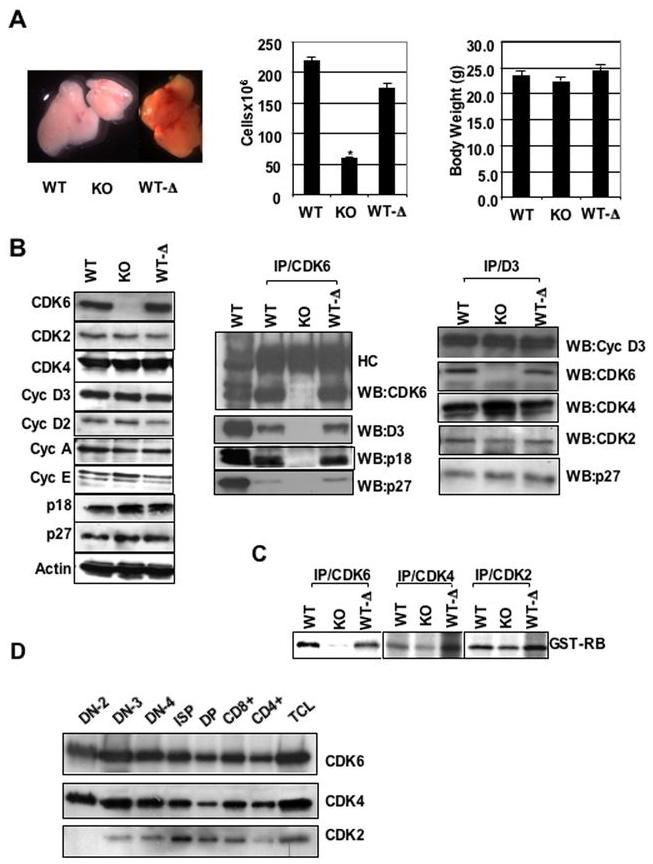
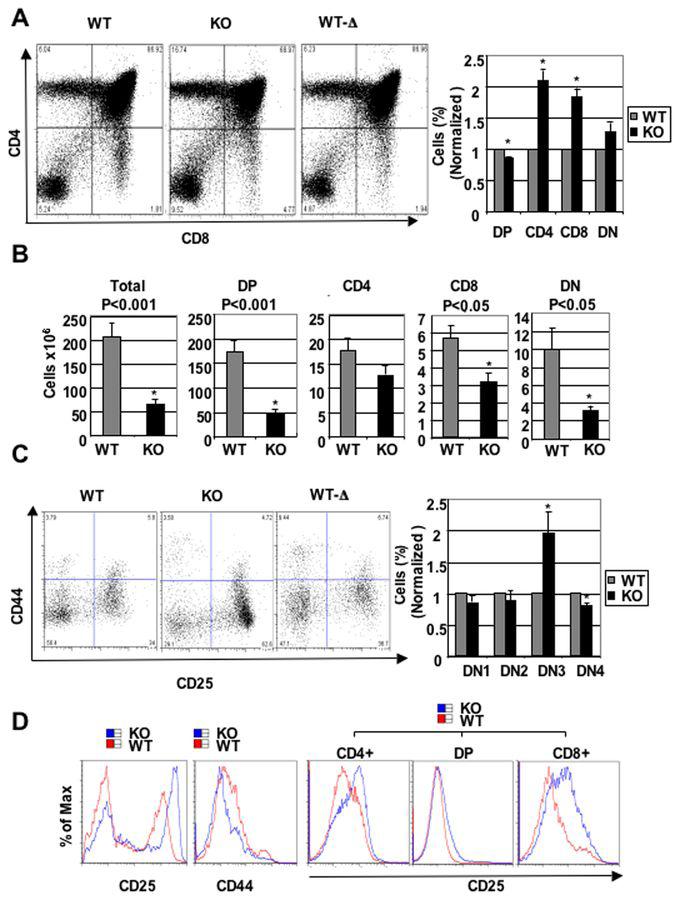
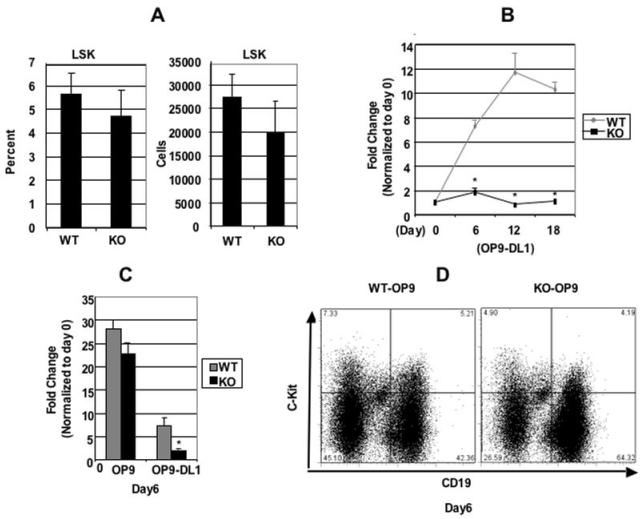
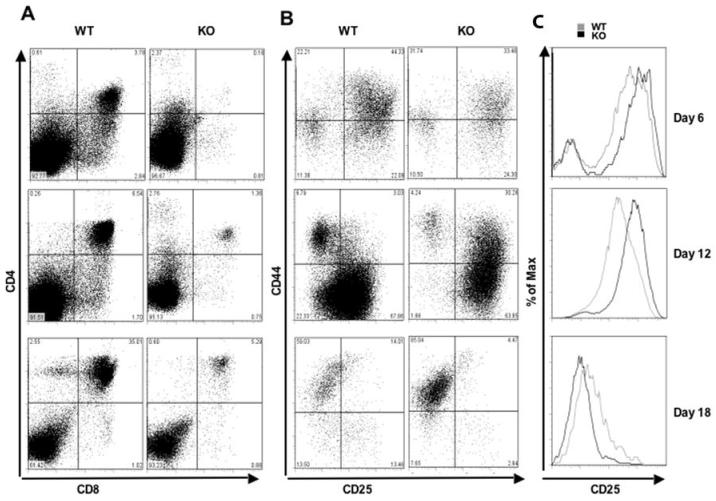
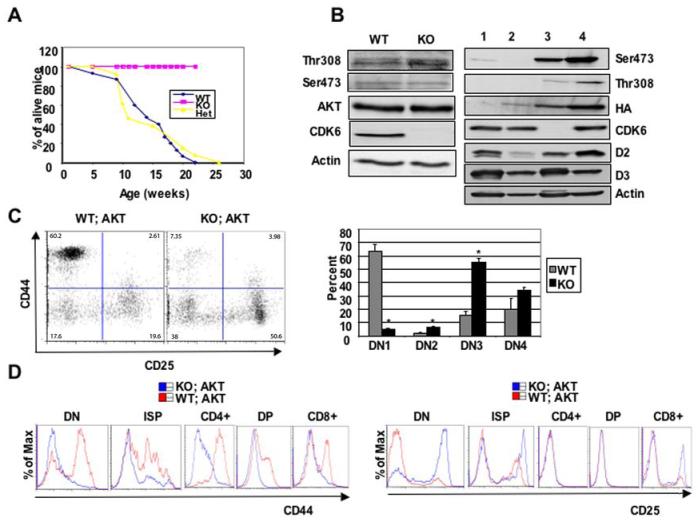
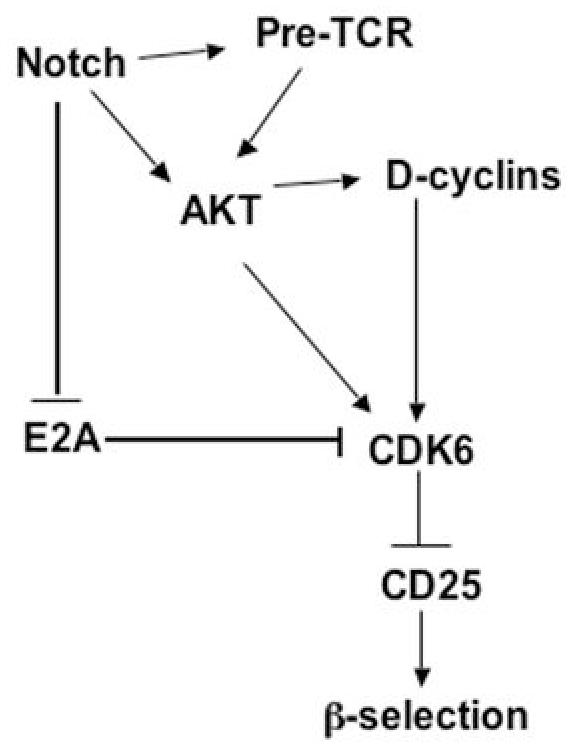
Cyclin-dependent kinase 6 (CDK6) promotes cell cycle progression and is overexpressed in human lymphoid malignancies. To determine the role of CDK6 in development and tumorigenesis, we generated and analyzed knockout mice. Cdk6-deficient mice show pronounced thymic atrophy due to reduced proliferative fractions and concomitant transitional blocks in the double-negative stages. Using the OP9-DL1 system to deliver temporally controlled Notch receptor-dependent signaling, we show that CDK6 is required for Notch-dependent survival, proliferation, and differentiation. Furthermore, CDK6-deficient mice were resistant to lymphomagenesis induced by active Akt, a downstream target of Notch signaling. These results show a critical requirement for CDK6 in Notch/Akt-dependent T-cell development and tumorigenesis and strongly support CDK6 as a specific therapeutic target in human lymphoid malignancies.


Figures

Figure 1
Figure 1
Defective thymocyte development in KO mice and analyses of cell cycle regulatory protein expression and function of kinases. A, left panel, Appearance of thymuses dissected from 2-month-old mice. A, middle panel, Total number of thymocytes from 1-3-month-old mice. The cell numbers are expressed as mean ± S.E (n= 15 for WT and KO, n=17 for WT-Δ). *, P value = 1.12508E-09 for WT and KO. Student T-test was used to confirm significant differences between pairs of animals. (A, right panel) Body weights of 1-3-month-old mice. The body weight is expressed as mean (g) ± S.E. B, left panel, Immunoblots were probed with different antibodies as indicated. Actin was used as internal control to ensure equal loading. B, middle and right panels, IP-Westerns. CDK6 or Cyclin D3 was immunoprecipitated from thymocyte extracts and the immunoblots were probed with the indicated antibodies, HC indicates IgG heavy chain. C, In vitro kinase assay. CDK6, CDK4, or CDK2 was immunoprecipitated from thymocyte extracts and an in vitro kinase assay was performed using the recombinant retinoblastoma protein (GST-RB) as a substrate. D, Immunoblot analysis of sorted thymocyte subsets (3 million cells of each subset) from wild-type mice. Upper, middle and bottom panels represent the same blot sequentially probed with antibodies against CDK6, CDK4 and CDK2.
Figure 2
Figure 2
Alteration of thymocyte subset fractions in thymuses of KO and WT-Δ mice. A, left panel, Examples of flow cytometric profiles of thymocytes from 2-month-old mice stained with anti-CD4, anti-CD8 and TCR-β antibodies. The percentage of cells in each quadrant is shown. A, right panel, The bar graph summarizes percentage of each subset from separate experiments (N=8). Data are expressed as mean ± S.E. *, p < 0.05, significantly different from the control levels which were arbitrarily defined as 1 unit (100%). B, Absolute cell numbers (×106) for the subsets were calculated and are shown as bar diagrams. The cell numbers are expressed as mean ± S.E. The statistical significance was calculated using the Student’s T-test; p-values are indicated above the bars. N=8 for WT and KO, *, p < 0.05, significantly different from the control levels which were arbitrarily defined as 1 unit (100%). C, Alteration in DN subsets. On the left, thymocytes from 2-month-old CDK6 KO or controls were stained with the ‘cocktail’ of lineage-specific antibodies and anti-CD44 and anti-CD25. Lineage-positive cells were electronically ‘gated out’ and CD44-versus-CD25 profiles of the lineage-negative compartments are presented. Numbers in quadrants indicate the percentage of cells in each subset. On the right, the bar graph summarizes percentage of each subset from separate (N=8) experiments. Data are expressed as mean ± S.E. *, p < 0.05, significantly different from the control levels which were arbitrarily defined as 1 unit. D, Examples of flow cytometric analysis of CD25 (left) or CD44 (middle) expression in DN thymocytes from WT and KO. On the right, examples of flow cytometric analysis of CD25 expression in CD4+, DP, and CD8+ subsets from WT and KO thymocytes.
Figure 3
Figure 3
CDK6 is required for Notch-dependent proliferation. A, Bone marrow (BM) cells obtained from WT and KO mice (from humerus and femur) were counted and stained with PE-conjugated antibodies specific for lineage (Lin) markers (CD3, CD4, CD8, B220, Mac-1, Gr-1, TER119) and SCA-1-Fitc, c-KIT-APC. Labeled cells were subsequently analyzed by FACS. The percentage of Lin-Sca-1+c-Kit+ (LSK) population (on the left) was expressed as mean ± S.E (n=4 for WT and KO). The absolute cell numbers (×106) for the LSK (On the right) were calculated based on the total number of cells and the percentage of LSK in the total cell population and are shown as bar diagrams. The cell numbers are expressed as mean ± S.E. N=4 for WT and KO. B, c-Kit+Lin- bone marrow cells were cocultured on OP9-DL1 cells and counted at times indicated. The expansion fold change was calculated based on the ratio between the total number counted at the time indicated versus the total c-Kit+Lin- cell number plated at day 0, which were arbitrarily defined as 1 unit. Data are expressed as mean ± S.E. *, p < 0.05, (N=5), significantly different from the control levels. C, c-Kit+Lin- bone marrow cells were cocultured on OP9 or OP9-DL1 cells and counted at day 6 indicated. The bar graph summarizes the fold changes over day 0 (which were arbitrarily defined as 1 unit) from separate (N=6) experiments. Data are expressed as mean ± S.E. *, p < 0.05, significantly different from the control levels which were arbitrarily defined as 1 unit. D, Representative example of FACS analysis for surface expression of CD19 and c-Kit of pre-B cells sorted from bone marrow and cultured for 6 days on OP9 cells.
Figure 4
Figure 4
CDK6 is required for Notch-dependent differentiation. A, Flow cytometry of WT and KO cells stained with CD4 and CD8. c-Kit+Lin- bone marrow cells were cocultured on OP9-DL1 stromal cells and analyzed by FACS at various time points as indicated. B, Flow cytometry of WT and KO cells stained with the ‘cocktail’ of lineage-specific antibodies and anti-CD44 and anti-CD25. Lineage-positive cells were electronically ‘gated out’ and CD44-versus-CD25 profiles of the lineage-negative compartments are presented. Numbers in quadrants indicate the percentage of cells in each subset stained with CD44 and CD25. C, Comparisons of flow cytometric analysis of CD25 expression in DN thymocytes from WT and KO cells (Figure 4B) collected from OP9-DL1 cocultures.
Figure 5
Figure 5
CDK6 operates downstream of Akt kinase. A, Comparison of tumor susceptibility between WT; Akt (n=21), Het;Akt (n=17), and KO;Akt (n=15) mice. B, Western blot analysis of thymocyte lysates derived from 4-week old WT or KO mice (left panel) or WT (lane 1) or WT;Akt (lane 2, pretumor) or 4-month old KO;Akt (lane 3) mice or WT;Akt (tumor cells, lane 4, right panel). Immunoblots were probed with different antibodies as indicated. Actin was used as an internal control to ensure equal loading. Anti-HA was used to detect transgene MyrAkt and distinguish it from endogenous Akt. C, On the left, the MyrAkt transgene failed to promote β-selection in the absence of CDK6. DN thymocytes from 4-week old WT;Akt and KO;Akt mice stained with the ‘cocktail’ of lineage-specific antibodies and anti-CD44 and anti-CD25. Lineage-positive cells were electronically ‘gated out’ and CD44-versus-CD25 profiles of the lineage-negative compartments are presented. Numbers in quadrants indicate the percentage of cells in each subset stained with CD44 and CD25. The bar graph (right panel) summarizes percentage of each subset from separate (n=3 for WT;Akt, n=4 for KO;Akt) experiments. Data are expressed as mean ± S.E. *, p < 0.05, significantly different from the control levels. D, Comparisons of flow cytometric analysis of CD44 (left panel) or CD25 (right panel) expression in some compartments from WT;Akt and KO;Akt.
Figure 6
Figure 6
Working model for CDK6 regulation of T cell development and tumorigenesis. Activation of Notch leads to (1) activation of AKT; (2) inhibition of E2A; and (3) induction of pre-Tα transcript (one component of pre-TCR). Akt has also been shown to work downstream of pre-TCR at the β-selection checkpoint. CDK6 as a downstream mediator of Akt, can be activated by (1) Activated Akt; (2) elevated D-cyclins; (3) Increased gene expression because of reduced E2A proteins. The activated CDK6 in turn suppresses the expression of CD25, ensuring DN3 stage cells transit to DN4. Work presented here demonstrates a need for CDK6 in Notch-dependent development of thymocytes and in AKT-driven lymphomagenesis; the model postulates that CDK6 also has a role in Notch-dependent tumor formation and in mediating AKT-dependent development. Future verification of this model would provide a clear indication of links between important developmental and cell cycle pathways in thymocytes and their exploitation by tumorigenic processes.

References

    1. Wilson A, MacDonald HR, Radtke F. Notch 1-deficient common lymphoid precursors adopt a B cell fate in the thymus. J Exp Med. 2001;194:1003–12. - PMC - PubMed
    1. Artavanis-Tsakonas S, Rand MD, Lake RJ. Notch signaling: cell fate control and signal integration in development. Science. 1999;284:770–6. - PubMed
    1. Radtke F, Wilson A, Stark G, et al. Deficient T cell fate specification in mice with an induced inactivation of Notch1. Immunity. 1999;10:547–58. - PubMed
    1. Schmitt TM, Zuniga-Pflucker JC. Induction of T cell development from hematopoietic progenitor cells by delta-like-1 in vitro. Immunity. 2002;17:749–56. - PubMed
    1. Aster JC, Pear WS, Blacklow SC. Notch Signaling in Leukemia. Annu Rev Pathol. 2008;3:587–613. - PMC - PubMed

Publication types

MeSH terms