

A gamma-tocopherol-rich mixture of tocopherols inhibits colon inflammation and carcinogenesis in azoxymethane and dextran sulfate sodium-treated mice
- PMID: 19155443
- PMCID: PMC2821738
- DOI: 10.1158/1940-6207.CAPR-08-0099
A gamma-tocopherol-rich mixture of tocopherols inhibits colon inflammation and carcinogenesis in azoxymethane and dextran sulfate sodium-treated mice
Abstract
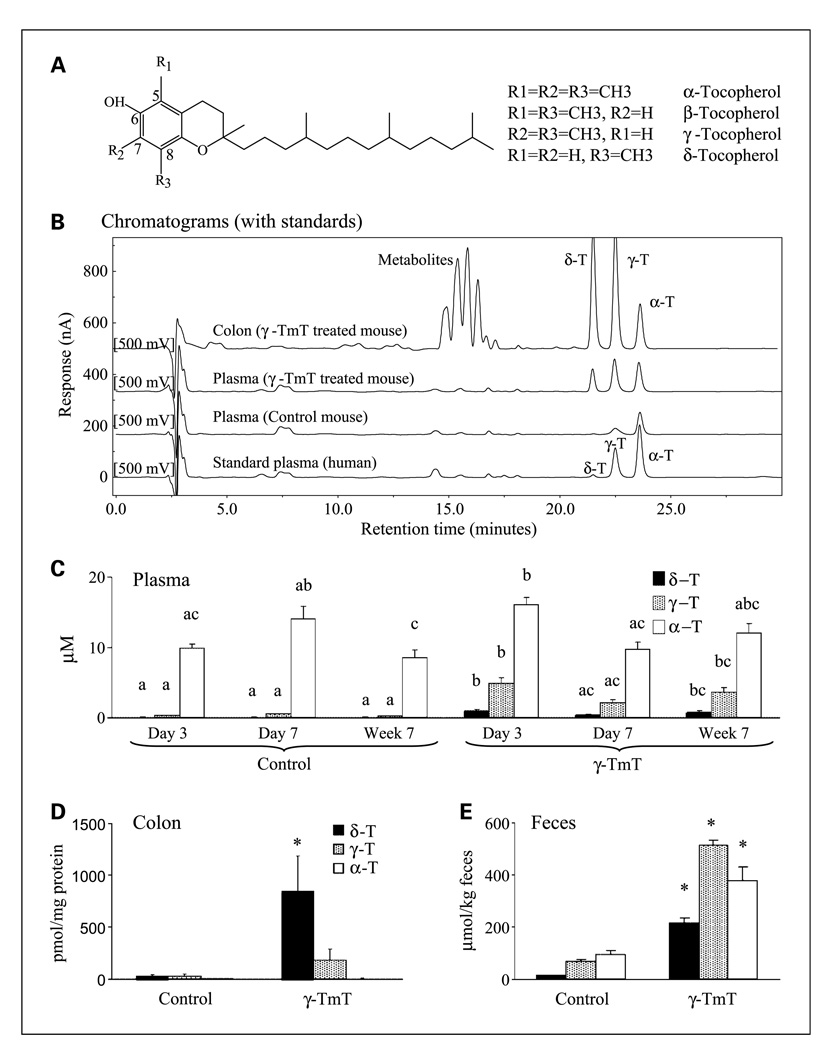
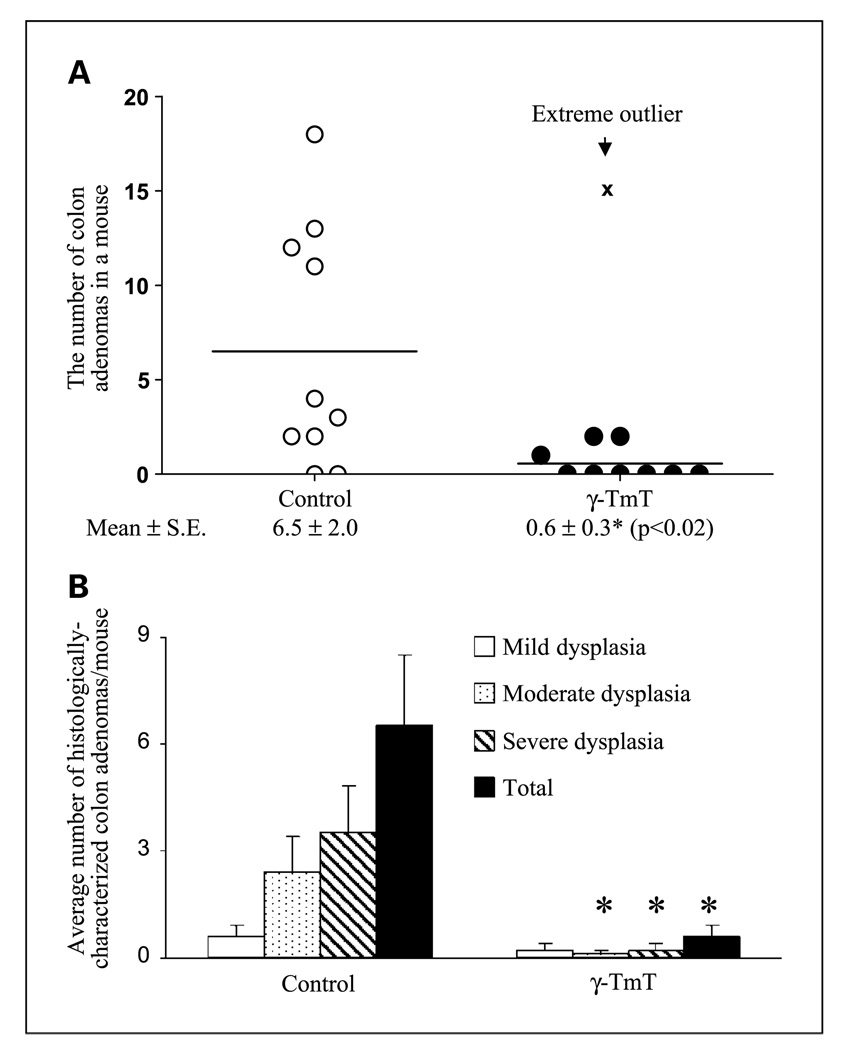
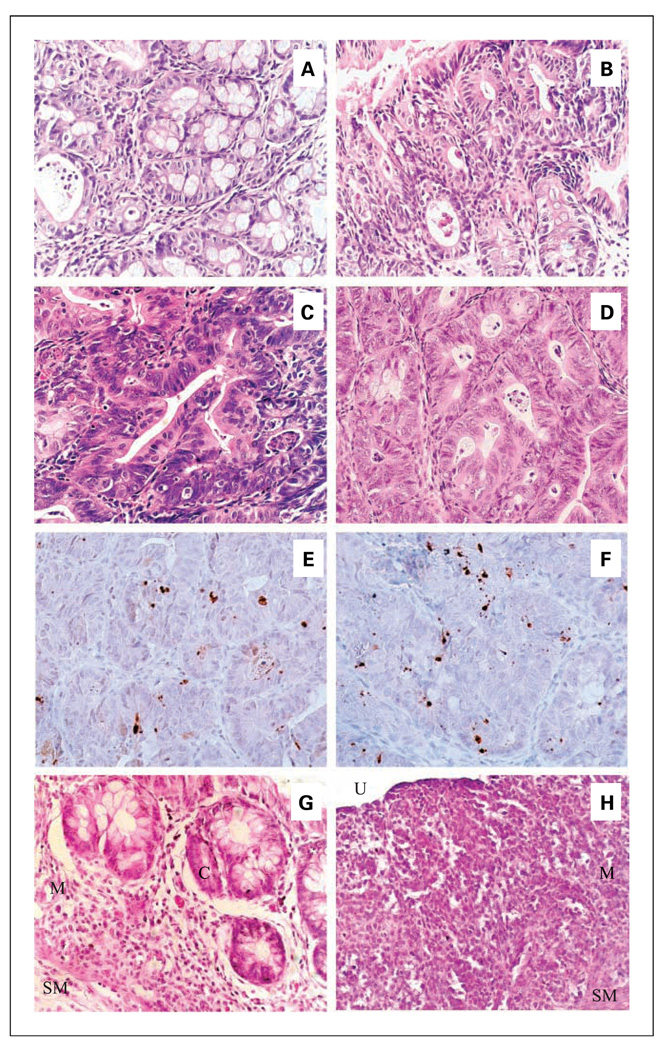
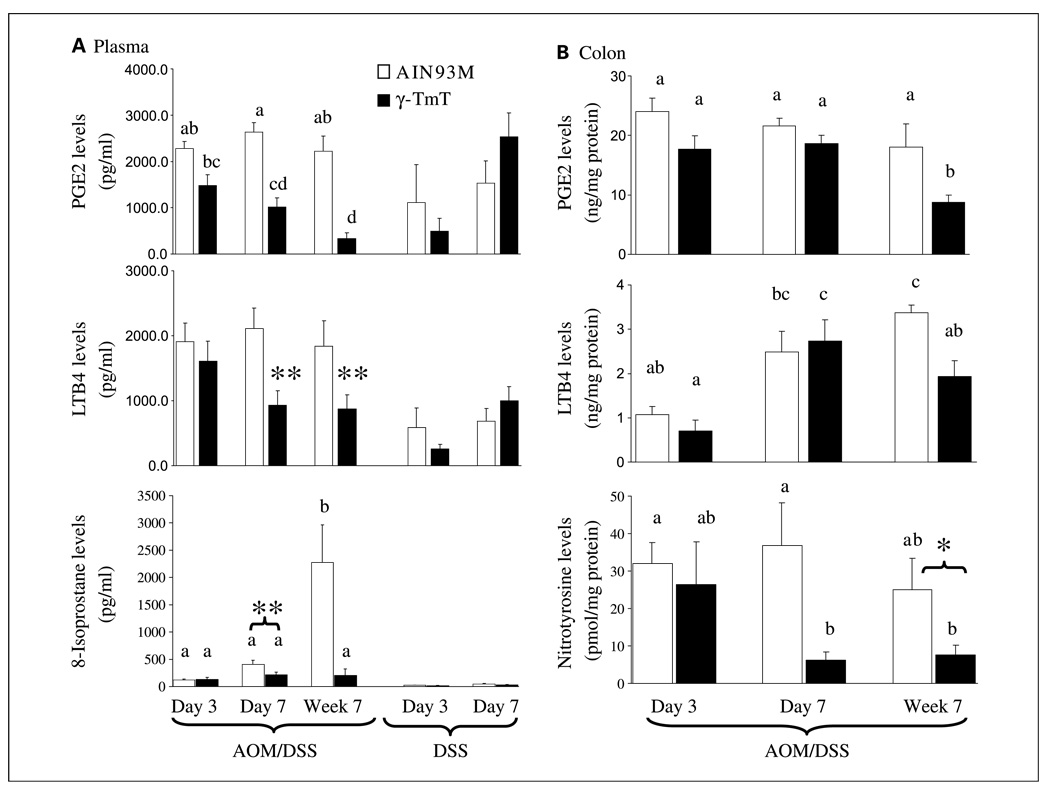
We investigated the effects of a gamma-tocopherol-rich mixture of tocopherols (gamma-TmT, containing 57% gamma-T, 24% delta-T, and 13% alpha-T) on colon carcinogenesis in azoxymethane (AOM)/dextran sulfate sodium (DSS)-treated mice. In experiment 1, 6-week-old male CF-1 mice were given a dose of AOM (10 mg/kg body weight, i.p.), and 1 week later, 1.5% DSS in drinking water for 1 week. The mice were maintained on either a gamma-TmT (0.3%)-enriched or a standard AIN93M diet, starting 1 week before the AOM injection, until the termination of experiment. In the AOM/DSS-treated mice, dietary gamma-TmT treatment resulted in a significantly lower colon inflammation index (52% of the control) on day 7 and number of colon adenomas (9% of the control) on week 7. gamma-TmT treatment also resulted in higher apoptotic index in adenomas, lower prostaglandin E2, leukotriene B4, and nitrotyrosine levels in the colon, and lower prostaglandin E2, leukotriene B4, and 8-isoprostane levels in the plasma on week 7. Some of the decreases were observed even on day 7. In experiment 2 with AOM/DSS- treated mice sacrificed on week 21, dietary 0.17% or 0.3% gamma-TmT treatment, starting 1 week before the AOM injection, significantly inhibited adenocarcinoma and adenoma formation in the colon (to 17-33% of the control). Dietary 0.3% gamma-TmT that was initiated after DSS treatment also exhibited a similar inhibitory activity. The present study showed that gamma-TmT effectively inhibited colon carcinogenesis in AOM/DSS-treated mice, and the inhibition may be due to the apoptosis-inducing, anti-inflammatory, antioxidative, and reactive nitrogen species-trapping activities of tocopherols.
Conflict of interest statement
No potential conflicts of interest were disclosed.
Figures
Similar articles
-
Bovine milk-derived α-lactalbumin inhibits colon inflammation and carcinogenesis in azoxymethane and dextran sodium sulfate-treated mice.Biosci Biotechnol Biochem. 2014;78(4):672-9. doi: 10.1080/09168451.2014.890034. Epub 2014 Apr 16. Biosci Biotechnol Biochem. 2014. PMID: 25036966
-
Dose-dependent promoting effect of dextran sodium sulfate on mouse colon carcinogenesis initiated with azoxymethane.Histol Histopathol. 2005 Apr;20(2):483-92. doi: 10.14670/HH-20.483. Histol Histopathol. 2005. PMID: 15736053
-
δ- and γ-tocopherols, but not α-tocopherol, inhibit colon carcinogenesis in azoxymethane-treated F344 rats.Cancer Prev Res (Phila). 2012 Apr;5(4):644-54. doi: 10.1158/1940-6207.CAPR-11-0521. Epub 2012 Feb 24. Cancer Prev Res (Phila). 2012. PMID: 22366914 Free PMC article.
-
Inhibition of inflammation and carcinogenesis in the lung and colon by tocopherols.Ann N Y Acad Sci. 2010 Aug;1203:29-34. doi: 10.1111/j.1749-6632.2010.05561.x. Ann N Y Acad Sci. 2010. PMID: 20716280 Free PMC article. Review.
-
The signal pathways in azoxymethane-induced colon cancer and preventive implications.Cancer Biol Ther. 2009 Jul;8(14):1313-7. doi: 10.4161/cbt.8.14.8983. Epub 2009 Jul 11. Cancer Biol Ther. 2009. PMID: 19502780 Review.
Cited by
-
Chemopreventive activity of vitamin E in breast cancer: a focus on γ- and δ-tocopherol.Nutrients. 2011 Nov;3(11):962-86. doi: 10.3390/nu3110962. Epub 2011 Nov 14. Nutrients. 2011. PMID: 22254089 Free PMC article. Review.
-
Chemistry meets biology in colitis-associated carcinogenesis.Free Radic Res. 2013 Nov;47(11):958-86. doi: 10.3109/10715762.2013.832239. Epub 2013 Oct 4. Free Radic Res. 2013. PMID: 23926919 Free PMC article. Review.
-
Different forms of vitamin E and metabolite 13'-carboxychromanols inhibit cyclooxygenase-1 and its catalyzed thromboxane in platelets, and tocotrienols and 13'-carboxychromanols are competitive inhibitors of 5-lipoxygenase.J Nutr Biochem. 2022 Feb;100:108884. doi: 10.1016/j.jnutbio.2021.108884. Epub 2021 Oct 25. J Nutr Biochem. 2022. PMID: 34710615 Free PMC article.
-
Gamma-tocopherol, a major form of vitamin E in diets: Insights into antioxidant and anti-inflammatory effects, mechanisms, and roles in disease management.Free Radic Biol Med. 2022 Jan;178:347-359. doi: 10.1016/j.freeradbiomed.2021.12.012. Epub 2021 Dec 9. Free Radic Biol Med. 2022. PMID: 34896589 Free PMC article.
-
Role of the δ-Opioid Receptor in 2 Murine Models of Colitis.Comp Med. 2020 Feb 1;70(1):25-34. doi: 10.30802/AALAS-CM-19-000024. Epub 2020 Jan 22. Comp Med. 2020. PMID: 31969211 Free PMC article.
References
-
- Traber MG. Vitamin E. Baltimore (MD): Lippincott Williams and Wilkins; 2006.
-
- Hensley K, Benaksas EJ, Bolli R, et al. New perspectives on vitamin E: γ-tocopherol and carboxyelthylhydroxychroman metabolites in biology and medicine. Free Radic Biol Med. 2004;36:1–15. - PubMed
-
- Eitenmiller T, Lee J. Vitamin E: food chemistry, composition, and analysis. New York: Marcel Dekker, Inc.; 2004.
-
- U.S. Department of Commerce and U.S. Bureau of the Census. Fat and oils: production, consumption, and stocks 2004. 2005
-
- Dietrich M, Traber MG, Jacques PF, Cross CE, Hu Y, Block G. Does γ-tocopherol play a role in the primary prevention of heart disease and cancer? A review. J Am Coll Nutr. 2006;25:292–299. - PubMed
Publication types
MeSH terms
Substances
Grants and funding
LinkOut - more resources
Full Text Sources
Medical
