

Acute alcohol intoxication inhibits the lineage- c-kit+ Sca-1+ cell response to Escherichia coli bacteremia
- PMID: 19155505
- PMCID: PMC2731630
- DOI: 10.4049/jimmunol.182.3.1568
Acute alcohol intoxication inhibits the lineage- c-kit+ Sca-1+ cell response to Escherichia coli bacteremia
Abstract
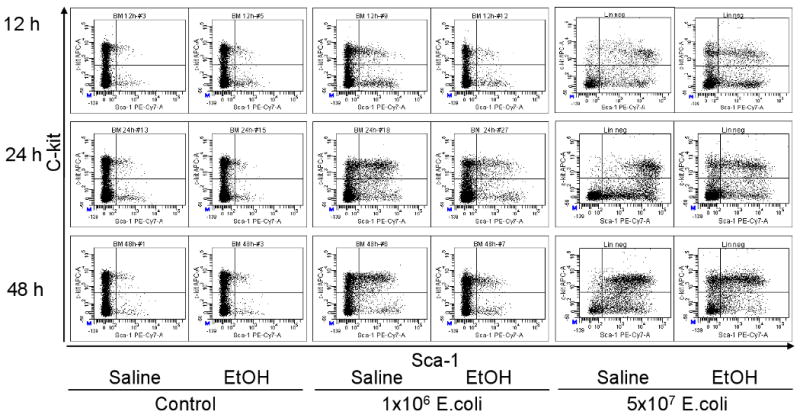
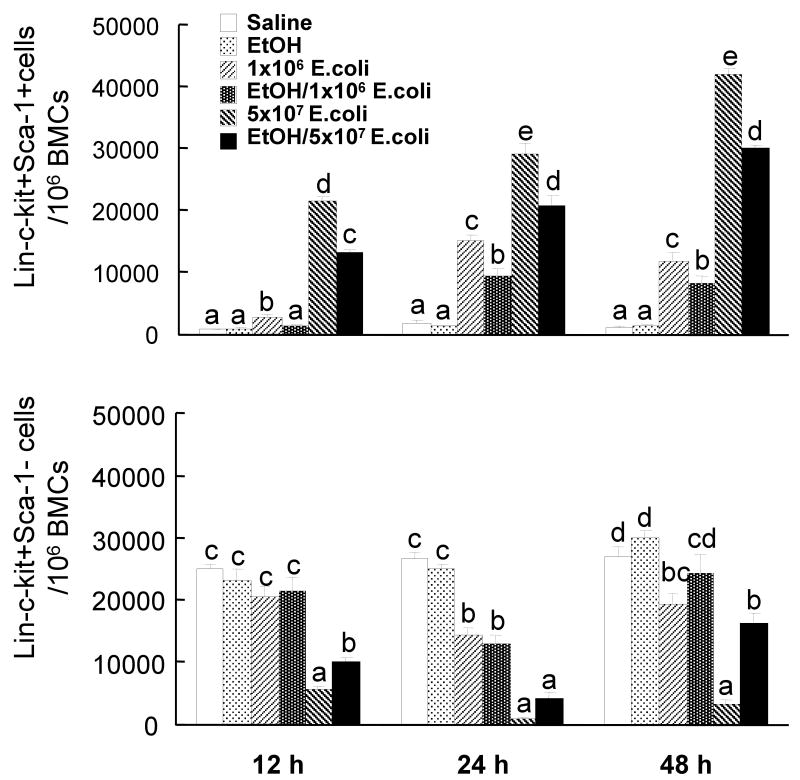
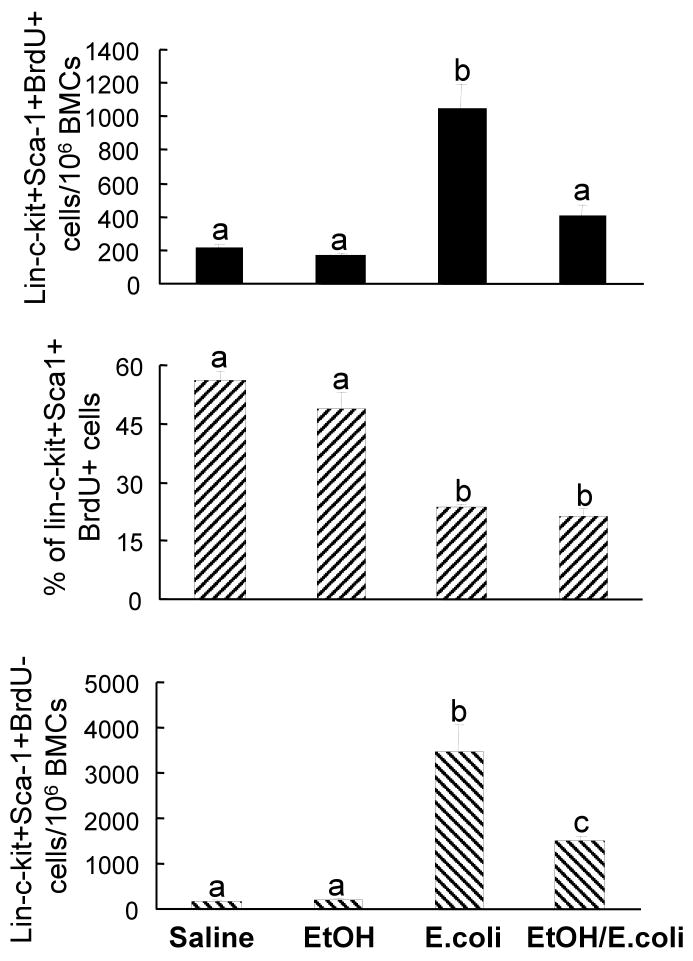
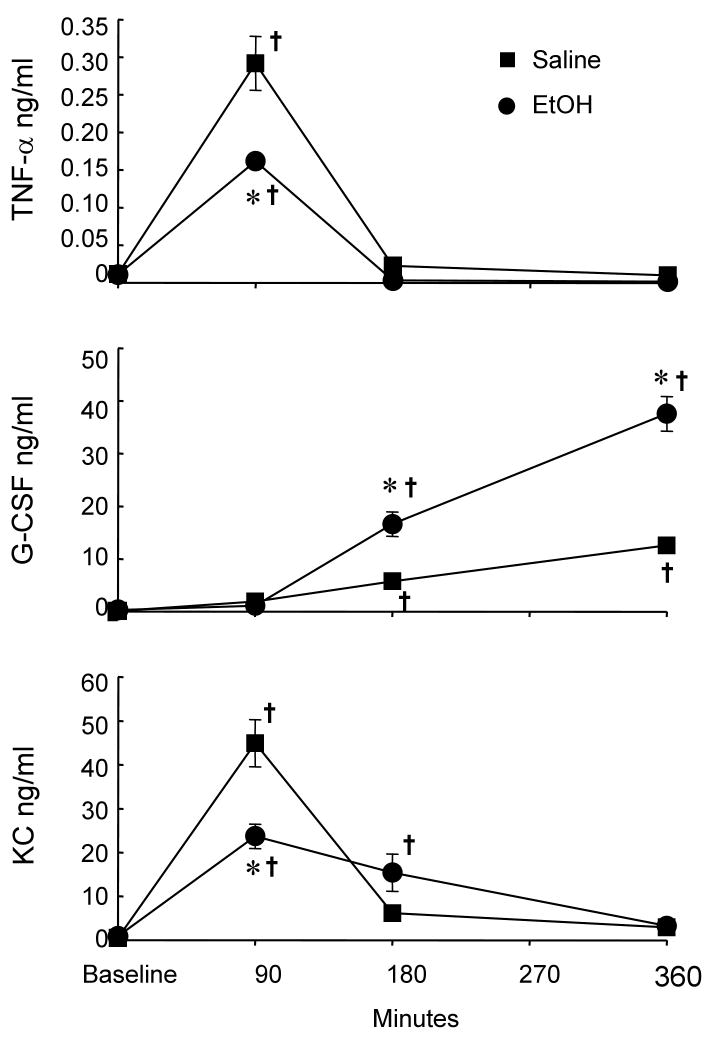
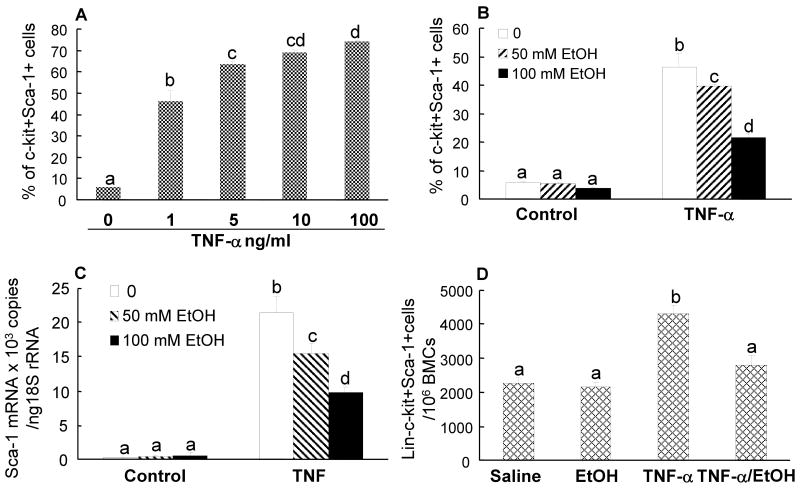
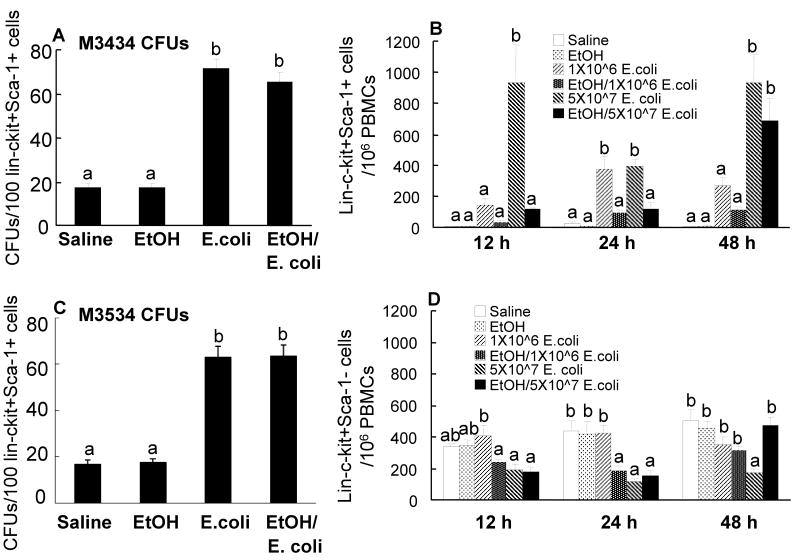
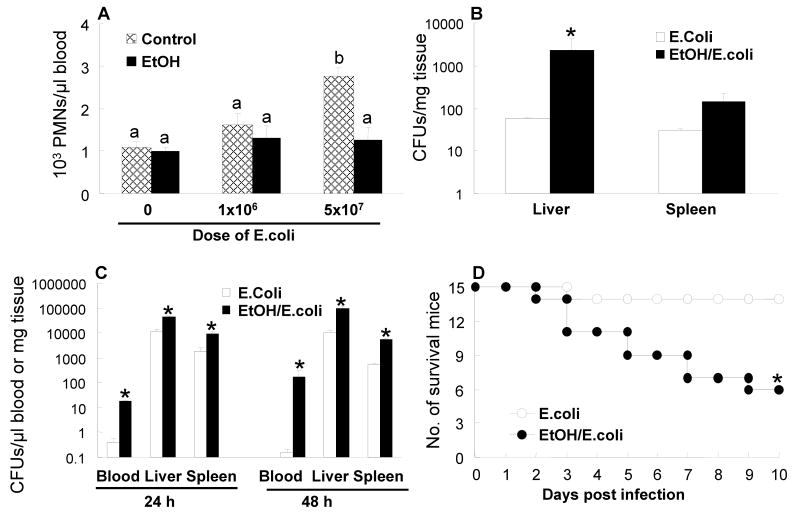
Alcohol abuse predisposes the host to bacterial infections. In response to bacterial infection, the bone marrow hematopoietic activity shifts toward granulocyte production, which is critical for enhancing host defense. This study investigated the hematopoietic precursor cell response to bacteremia and how alcohol affects this response. Acute alcohol intoxication was induced in BALB/c mice 30 min before initiation of Escherichia coli bacteremia. Bacteremia caused a significant increase in the number of bone marrow lineage (lin(-))-c-kit(+)Sca-1(+) cells. Marrow lin(-)c-kit(+)Sca-1(+) cells isolated from bacteremic mice showed an increase in CFU-granulocyte/macrophage activity compared with controls. In addition to enhanced proliferation of lin(-)c-kit(+)Sca-1(+) cells as reflected by BrdU incorporation, phenotypic inversion of lin(-)c-kit(+)Sca-1(+)Sca-1(-) cells primarily accounted for the rapid increase in marrow lin(-)c-kit(+)Sca-1(+) cells following bacteremia. Bacteremia increased plasma concentration of TNF-alpha. Culture of marrow lin(-)c-kit(+)Sca-1(+)Sca-1(-) cells with murine rTNF-alpha for 24 h caused a dose-dependent increase in conversion of these cells to lin(-)c-kit(+)Sca-1(+) cells. Sca-1 mRNA expression by the cultured cells was also up-regulated following TNF-alpha stimulation. Acute alcohol intoxication inhibited the increase in the number of lin(-)c-kit(+)Sca-1(+) cells in the bone marrow after E. coli infection. Alcohol impeded the increase in BrdU incorporation into marrow lin(-)c-kit(+)Sca-1(+) cells in response to bacteremia. Alcohol also suppressed the plasma TNF-alpha response to bacteremia and inhibited TNF-alpha-induced phenotypic inversion of lin(-)c-kit(+)Sca-1(+)Sca-1(-) cells in vitro. These data show that alcohol inhibits the hematopoietic precursor cell response to bacteremia, which may serve as one mechanism underlying the impaired host defense in alcohol abusers with severe bacterial infections.
Figures
Similar articles
-
The lineage-c-Kit+Sca-1+ cell response to Escherichia coli bacteremia in Balb/c mice.Stem Cells. 2008 Jul;26(7):1778-86. doi: 10.1634/stemcells.2007-1027. Epub 2008 May 15. Stem Cells. 2008. PMID: 18483422 Free PMC article.
-
Toll-like receptor 4/stem cell antigen 1 signaling promotes hematopoietic precursor cell commitment to granulocyte development during the granulopoietic response to Escherichia coli bacteremia.Infect Immun. 2013 Jun;81(6):2197-205. doi: 10.1128/IAI.01280-12. Epub 2013 Apr 1. Infect Immun. 2013. PMID: 23545304 Free PMC article.
-
Impairment of Hematopoietic Precursor Cell Activation during the Granulopoietic Response to Bacteremia in Mice with Chronic-Plus-Binge Alcohol Administration.Infect Immun. 2017 Oct 18;85(11):e00369-17. doi: 10.1128/IAI.00369-17. Print 2017 Nov. Infect Immun. 2017. PMID: 28784931 Free PMC article.
-
Alcohol impairs the myeloid proliferative response to bacteremia in mice by inhibiting the stem cell antigen-1/ERK pathway.J Immunol. 2012 Feb 15;188(4):1961-9. doi: 10.4049/jimmunol.1102395. Epub 2012 Jan 11. J Immunol. 2012. PMID: 22238460 Free PMC article.
-
[Isolation and characterization of the hematopoietic stem cell].Rinsho Ketsueki. 1995 May;36(5):400-5. Rinsho Ketsueki. 1995. PMID: 7783342 Review. Japanese.
Cited by
-
The Confounders of Cancer Immunotherapy: Roles of Lifestyle, Metabolic Disorders and Sociological Factors.Cancers (Basel). 2020 Oct 15;12(10):2983. doi: 10.3390/cancers12102983. Cancers (Basel). 2020. PMID: 33076303 Free PMC article. Review.
-
Mechanisms of neutrophil accumulation in the lungs against bacteria.Am J Respir Cell Mol Biol. 2010 Jul;43(1):5-16. doi: 10.1165/rcmb.2009-0047TR. Epub 2009 Sep 8. Am J Respir Cell Mol Biol. 2010. PMID: 19738160 Free PMC article. Review.
-
Neutropenia during HIV infection: adverse consequences and remedies.Int Rev Immunol. 2014 Nov-Dec;33(6):511-36. doi: 10.3109/08830185.2014.893301. Epub 2014 Mar 21. Int Rev Immunol. 2014. PMID: 24654626 Free PMC article. Review.
-
Transcriptional and Epigenetic Regulation of Monocyte and Macrophage Dysfunction by Chronic Alcohol Consumption.Front Immunol. 2022 Jun 29;13:911951. doi: 10.3389/fimmu.2022.911951. eCollection 2022. Front Immunol. 2022. PMID: 35844518 Free PMC article. Review.
-
Epigenetic targets for reversing immune defects caused by alcohol exposure.Alcohol Res. 2013;35(1):97-113. Alcohol Res. 2013. PMID: 24313169 Free PMC article. Review.
References
-
- Kondo M, Wagers AJ, Manz MG, Prohaska SS, Scherer DC, Beilhack GF, Shizuru JA, Weissman IL. Biology of hematopoietic stem cells and progenitors: implications for clinical application. Annu Rev Immunol. 2003;21:759–806. - PubMed
-
- Akala OO, Clarke MF. Hematopoietic stem cell self-renewal. Curr Opin Genet Dev. 2006;16:496–501. - PubMed
-
- Hartmann DW, Entringer MA, Robinson WA, Vasil ML, Drebing CJ, Morton NJ, True L. Regulation of granulopoiesis and distribution of granulocytes in early phase of bacterial infection. J Cell Physiol. 1981;109:17–24. - PubMed
-
- Barthlen W, Zanti N, Pfeffer K, Heidecke CD, Holzmann B, Stadler J. Impact of experimental peritonitis on bone marrow cell function. Surgery. 1999;126:41–47. - PubMed
Publication types
MeSH terms
Substances
Grants and funding
LinkOut - more resources
Full Text Sources
Other Literature Sources
Medical
Research Materials
