. 2009 Feb 10;100(3):511-23.
doi: 10.1038/sj.bjc.6604884. Epub 2009 Jan 20.

Dysregulation of the transcription factors SOX4, CBFB and SMARCC1 correlates with outcome of colorectal cancer

Affiliations

Dysregulation of the transcription factors SOX4, CBFB and SMARCC1 correlates with outcome of colorectal cancer

C L Andersen et al. Br J Cancer. .

Abstract

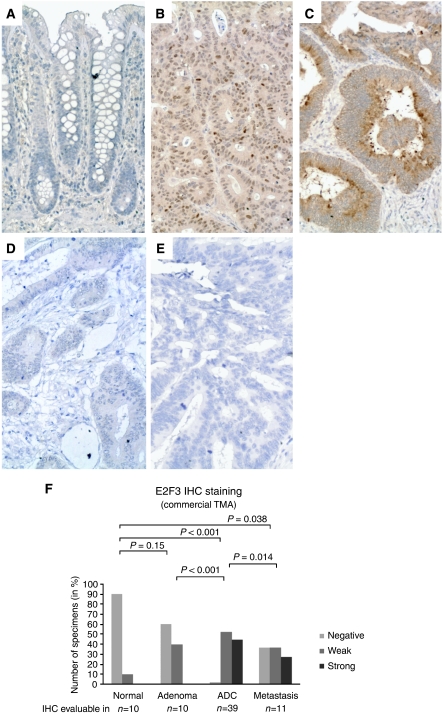
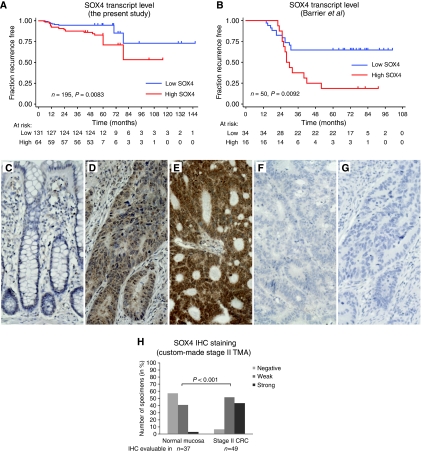
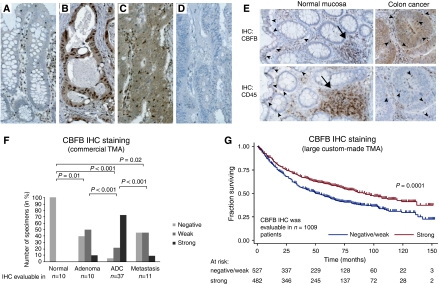
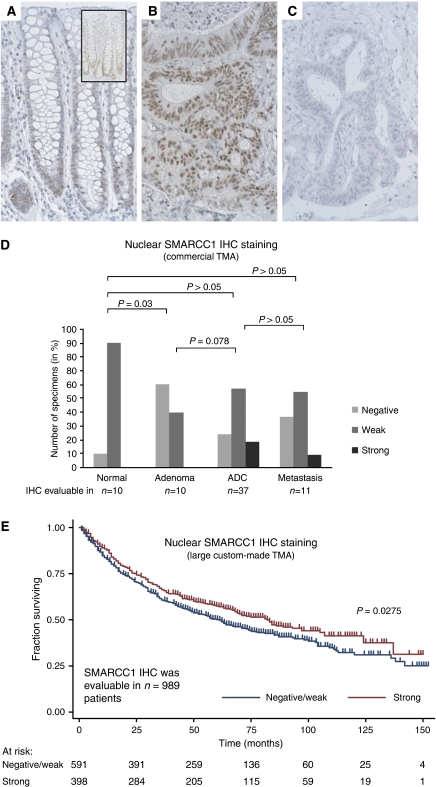
The aim of this study was to identify deregulated transcription factors (TFs) in colorectal cancer (CRC) and to evaluate their relation with the recurrence of stage II CRC and overall survival. Microarray-based transcript profiles of 20 normal mucosas and 424 CRC samples were used to identify 51 TFs displaying differential transcript levels between normal mucosa and CRC. For a subset of these we provide in vitro evidence that deregulation of the Wnt signalling pathway can lead to the alterations observed in tissues. Furthermore, in two independent cohorts of microsatellite-stable stage II cancers we found that high SOX4 transcript levels correlated with recurrence (HR 2.7; 95% CI, 1.2-6.0; P=0.01). Analyses of approximately 1000 stage I-III adenocarcinomas, by immunohistochemistry, revealed that patients with tumours displaying high levels of CBFB and SMARCC1 proteins had a significantly better overall survival rate (P=0.0001 and P=0.0275, respectively) than patients with low levels. Multivariate analyses revealed that a high CBFB protein level was an independent predictor of survival. In conclusion, several of the identified TFs seem to be involved in the progression of CRC.


Figures

Figure 1
Figure 1
E2F3 expression detected by immunohistochemistry. E2F3 IHC analysis of the commercial TMA, COCA 912-5-OL, containing normal mucosa as well as benign and malignant colorectal specimens demonstrated that although E2F3 was not expressed by normal epithelial cells (A) E2F3 was found de novo synthesised by the majority of the investigated neoplastic tissues (B and C). The subcellular localisation of the de novo synthesised E2F3 protein was in some tumours found to be primarily nuclear (B) and cytoplasmic in others (C). Adenocarcinomas with no E2F3 staining (negative) were also observed, though only rarely (D). These were very similar to the ‘no primary’ antibody negative control (E). The frequency and intensity of E2F3 protein expression (combining nuclear and cytoplasmic staining) in adenoma, adenocarcinoma and metastasis samples were significantly higher than in normal mucosa (F). The same was the case when nuclear and cytoplasmic staining was evaluated individually (data not shown). The E2F3 IHC staining was evaluable and scored in 70 of the 71 tissue cores in the commercial TMA. P-values correspond to Fisher's exact tests. ADC=adenocarcinoma. All images are × 20. Staining: brown, E2F3; blue, haematoxylin counterstain.
Figure 2
Figure 2
Analysis of SOX4 transcript and protein expression levels. Shown are censored Kaplan–Meier curves for recurrence-free survival of MSS stage II CRC according to the transcriptional expression level of SOX4 as measured by microarray expression profiling in this study (A) and the study by Barrier et al (2006) (B). The P-values correspond to the log-rank test. To investigate whether the SOX4 protein expression level changed from normal mucosa to adenocarcinoma, IHC was applied to a custom-made stage II TMA. The TMA tissue cores were not scored if they were missing, or contained fewer than 10 cancer cells, or demonstrated significant tissue or IHC staining artefacts. Hence, only 49 of the 51 adenocarcinoma and 37 of the 49 normal mucosa cores in the TMA were scored. In the majority of the normal mucosa samples, SOX4 was either not (C) or only weakly expressed. By contrast, a strong SOX4 staining was observed in more than 40% of the stage II adenocarcinomas. Often, the SOX4 protein was localised both in the cytoplasm and in the nucleus of the cancer cells. In some adenocarcinomas, the SOX4 staining was strongest in the nucleus (D), whereas in others, the cytoplasm and the nucleus were stained equally strong (E). Adenocarcinomas with no SOX4 staining (negative) were also observed, though only rarely (F). These were highly similar to the ‘no primary’ antibody negative control (G). The distribution of SOX4 IHC scores (combined nuclear and cytoplasmic staining) showed that both the frequency and the intensity of SOX4 staining were increased in the adenocarcinomas compared with those in the normal mucosas (H). The same was the case when the nuclear and cytoplasmic IHC scores were analysed individually (data not shown). The P-values were calculated using the χ2 test. All IHC images are × 20. Staining: brown, SOX4; blue, haematoxylin counterstain.
Figure 3
Figure 3
CBFB protein expression and the relation to survival. The CBFB protein expression was investigated by IHC in normal mucosa, adenoma, adenocarcinoma and metastases using the commercial TMA COCA 912-5-OL. Tissue microarray tissue cores were not scored if they were missing, or contained fewer than 10 cancer cells, or demonstrated significant tissue or staining artefacts. Hence, of the 71 tissue cores in the commercial TMA, 68 were scored for CBFB expression. The IHC analysis showed that whereas CBFB was not expressed by normal epithelial cells (A) CBFB was found de novo synthesised by the majority of the investigated neoplastic tissues (B and C). The subcellular localisation of the de novo synthesised CBFB protein was in some tumours found to be primarily nuclear (B) and cytoplasmic in others (C). Adenocarcinomas with no CBFB staining (negative) were also observed (D). Often small intensely staining cells were seen in the stroma and infiltrating both the normal epithelia (A) and the cancer cells (C). Comparison of sections cut from the same biopsies and stained with CBFB and CD45 (a pan-leukocyte marker) indicated that the small cells with intense CBFB staining represent infiltrating leukocytes (E). The distribution of the CBFB IHC scores in normal mucosa, adenoma, adenocarcinoma and metastases illustrates that CBFB is de novo synthesised in neoplastic tissue and that the frequency and intensity of the staining (combined cytoplasmic and nuclear staining) increases from adenoma to adenocarcinoma, and then drops back down again in metastases (F). Similar results were reached when the cytoplasmic and nuclear staining were analysed individually (data not shown). P-values correspond to Fisher's exact tests. To investigate if the CBFB protein level was correlated with overall survival, IHC was applied to a large custom-made TMA containing adenocarcinoma tissue cores from 1283 patients with available follow-up information. The CBFB IHC staining was evaluable in 1009 of these patients. Shown in (G) are censored Kaplan–Meier curves as a function of the CBFB IHC scores (nuclear and cytoplasmic scores combined). The individual survival curves for patients with negative and weak IHC scores were very similar, and they were therefore treated as one group. Similar results were reached when the cytoplasmic and nuclear staining were analysed individually (data not shown). The P-value corresponds to the log-rank test comparing the survival curves. See Supplementary Table 3A for a summary of the clinical characteristics and follow-up information available for the 1009 patients. See Supplementary Table 3C for the distribution of the 1009 IHC scores and their correlations with the available clinicopathological parameters. Arrow heads: infiltrating lymphocytes. Arrows: lymphoid nodules. All images are × 20. Staining: brown, CBFB or CD45 as indicated; blue, haematoxylin counterstain.
Figure 4
Figure 4
SMARCC1 protein expression and the relation to survival. The SMARCC1 protein expression was investigated by IHC in normal mucosa, adenoma, adenocarcinoma and metastases using the commercial TMA COCA 912-5-OL. Tissue microarray tissue cores were not scored if they were missing, or contained fewer than 10 cancer cells or demonstrated significant tissue or staining artefacts. Hence, of the 71 tissue cores in the commercial TMA, 68 were scored for SMARCC1 expression. The IHC analysis showed that in normal colon mucosa, SMARCC1 was weakly expressed in the lower third of the crypts of (A). The inset in (A) represents an IHC analysis of the same specimen but without the counterstain, making the SMARCC1 staining at the bottom of the crypts stand out more clearly. In contrast to the normal mucosa, the SMARCC1 staining seen in the neoplastic tissues was often more intense and uniformly distributed (B). Neoplastic tissues with no SMARCC1 staining (negative) were also observed (C). The subcellular localisation of the SMARCC1 protein was in both the normal epithelial cells and in the neoplastic cells restricted to the nucleus (A and B). As SMARCC1 was already expressed by the normal mucosa, comparisons of the SMARCC1 IHC scores in normal mucosa, adenocarcinoma and metastases revealed no significant differences (D). P-values correspond to Fisher's exact tests. To investigate if the SMARCC1 protein level was correlated with overall survival, IHC was applied to a large custom-made TMA containing adenocarcinoma tissue cores from 1283 patients with available follow-up information. The SMARCC1 IHC staining was evaluable in 989 of these patients. Shown in (E) are censored Kaplan–Meier survival curves as a function of the SMARCC1 IHC scores. The individual survival curves for patients with negative and weak IHC scores were very similar and they were therefore treated as one group. The P-value corresponds to the log-rank test comparing the survival curves. See Supplementary Table 3A for a summary of the clinical characteristics and follow-up information available for the 989 patients. See Supplementary Table 3D for the distribution of the 989 IHC scores and their correlations with the available clinicopathological parameters. All images are × 20. Staining: brown, SMARCC1; blue, haematoxylin counterstain.

References

    1. Aaboe M, Birkenkamp-Demtroder K, Wiuf C, Sorensen FB, Thykjaer T, Sauter G, Jensen KM, Dyrskjot L, Orntoft T (2006) SOX4 expression in bladder carcinoma: clinical aspects and in vitro functional characterization. Cancer Res 66: 3434–3442 - PubMed
    1. Andersen CL, Jensen JL, Orntoft TF (2004) Normalization of real-time quantitative reverse transcription-PCR data: a model-based variance estimation approach to identify genes suited for normalization, applied to bladder and colon cancer data sets. Cancer Res 64: 5245–5250 - PubMed
    1. Barrier A, Boelle PY, Roser F, Gregg J, Tse C, Brault D, Lacaine F, Houry S, Huguier M, Franc B, Flahault A, Lemoine A, Dudoit S (2006) Stage II colon cancer prognosis prediction by tumor gene expression profiling. J Clin Oncol 24: 4685–4691 - PubMed
    1. Bartkova J, Horejsi Z, Koed K, Kramer A, Tort F, Zieger K, Guldberg P, Sehested M, Nesland JM, Lukas C, Orntoft T, Lukas J, Bartek J (2005) DNA damage response as a candidate anti-cancer barrier in early human tumorigenesis. Nature 434: 864–870 - PubMed
    1. Birkenkamp-Demtroder K, Christensen LL, Olesen SH, Frederiksen CM, Laiho P, Aaltonen LA, Laurberg S, Sorensen FB, Hagemann R, Ørntoft TF (2002) Gene expression in colorectal cancer. Cancer Res 62: 4352–4363 - PubMed

Publication types