. 2009 Jan;4(1):119-28.
doi: 10.1002/biot.200800224.

Production of random DNA oligomers for scalable DNA computing

Affiliations

Production of random DNA oligomers for scalable DNA computing

Sixue S L Wang et al. Biotechnol J. 2009 Jan.

Erratum in

  • Biotechnol J. 2014 Nov;9(11):1458. Austin, Alan [corrected to Austin, Allen]

Abstract

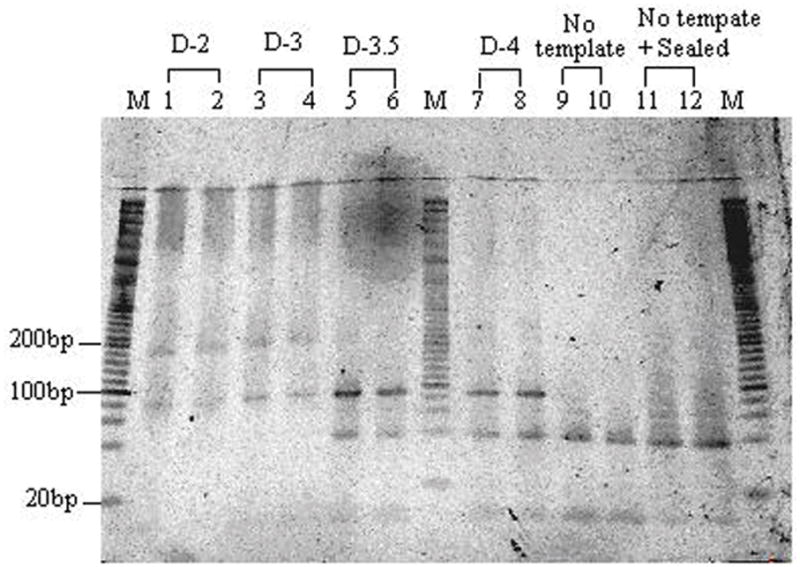
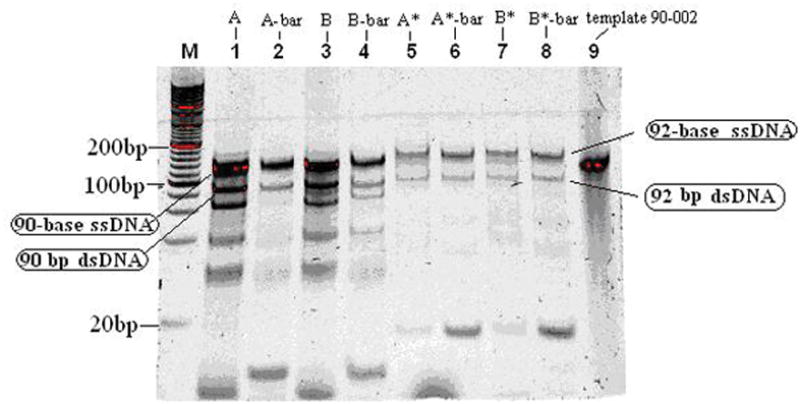
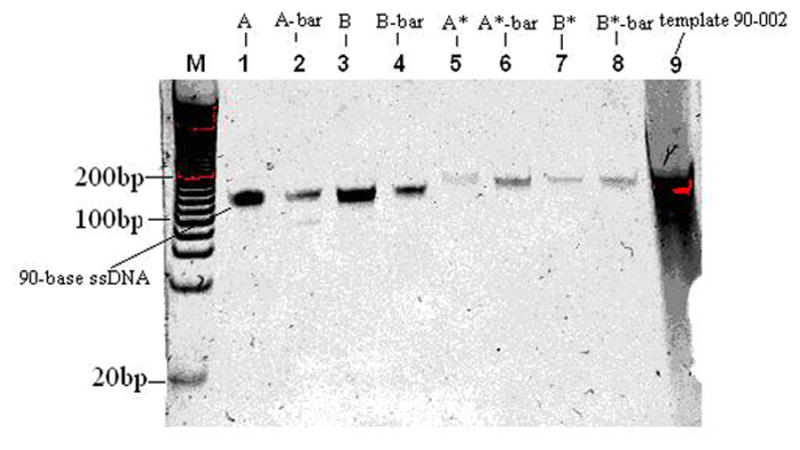
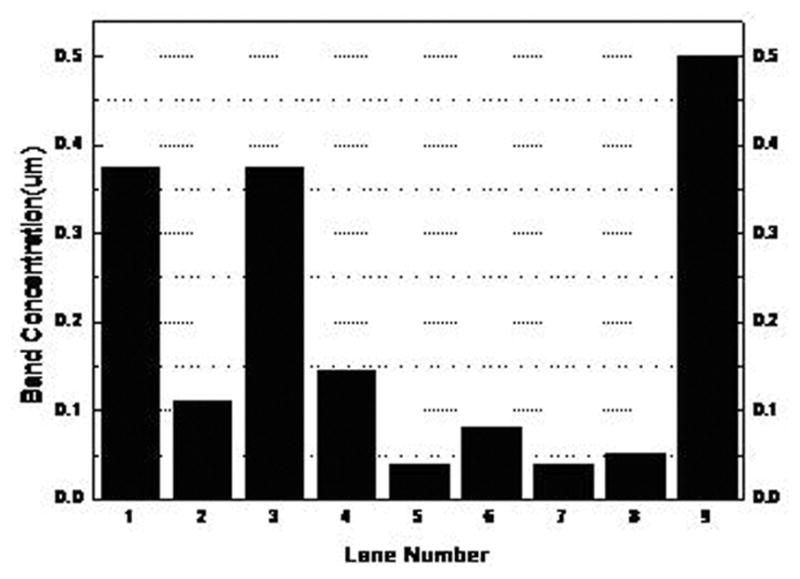
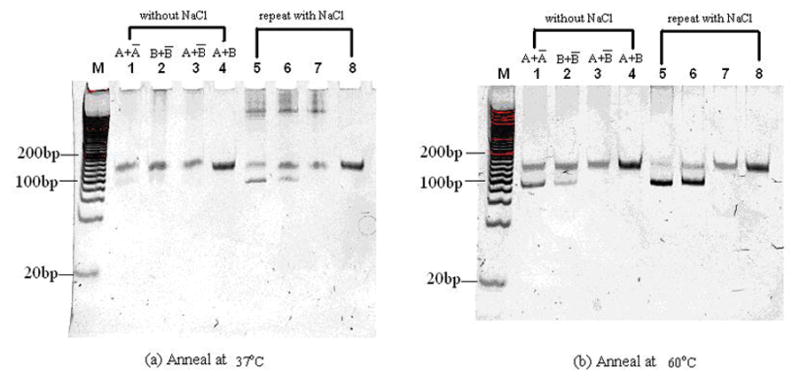
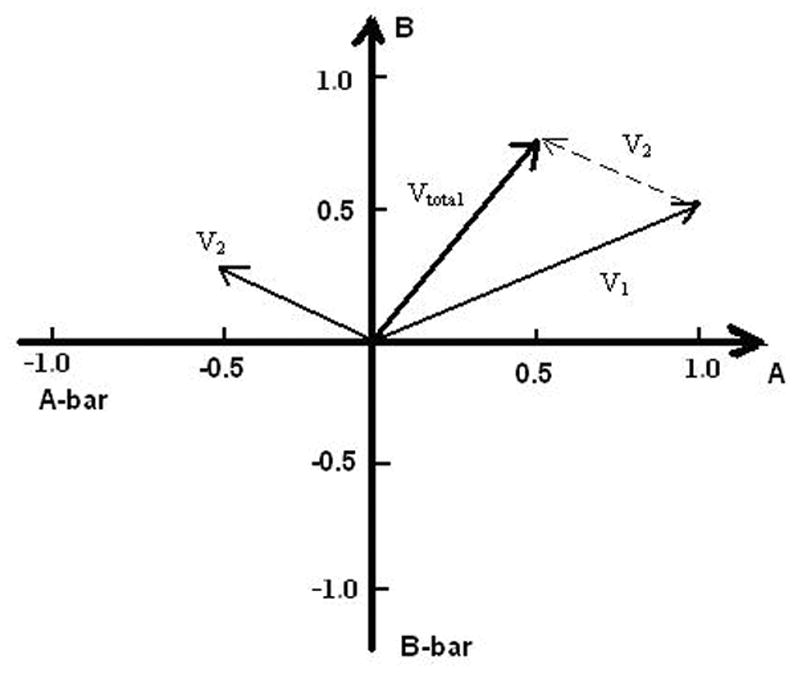
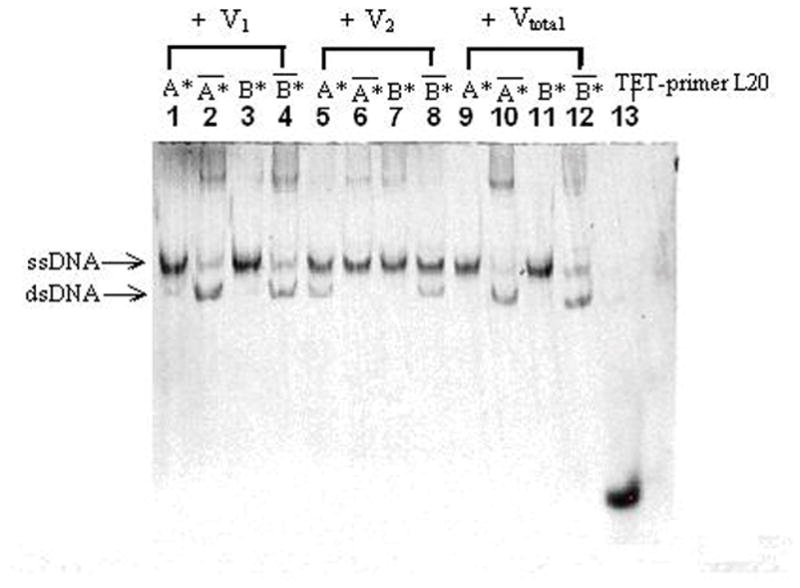
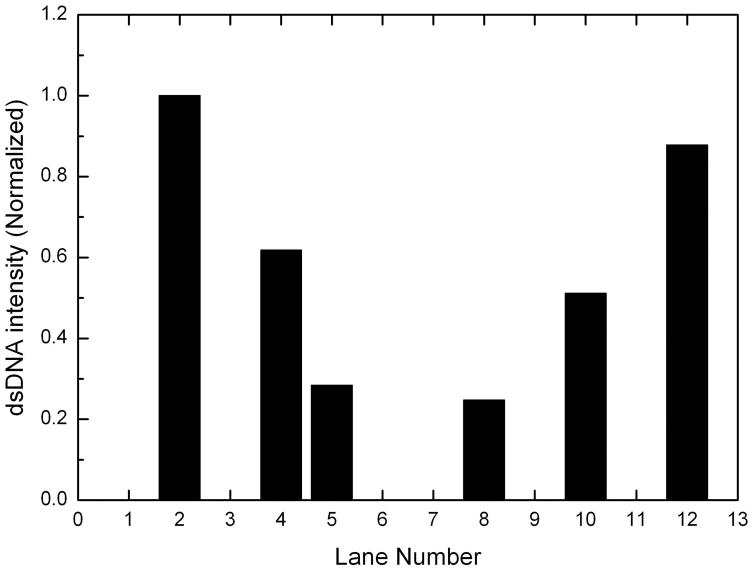
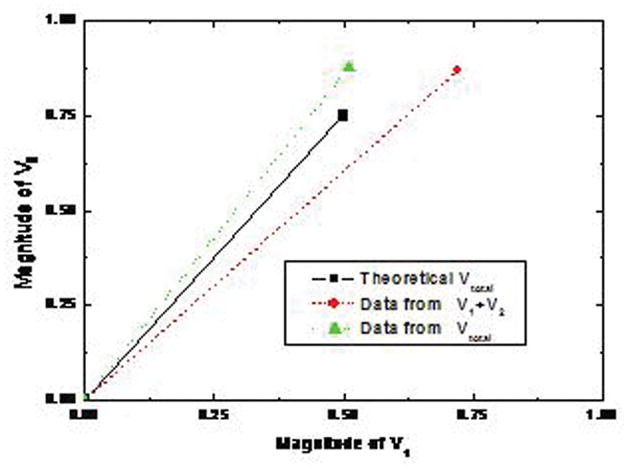
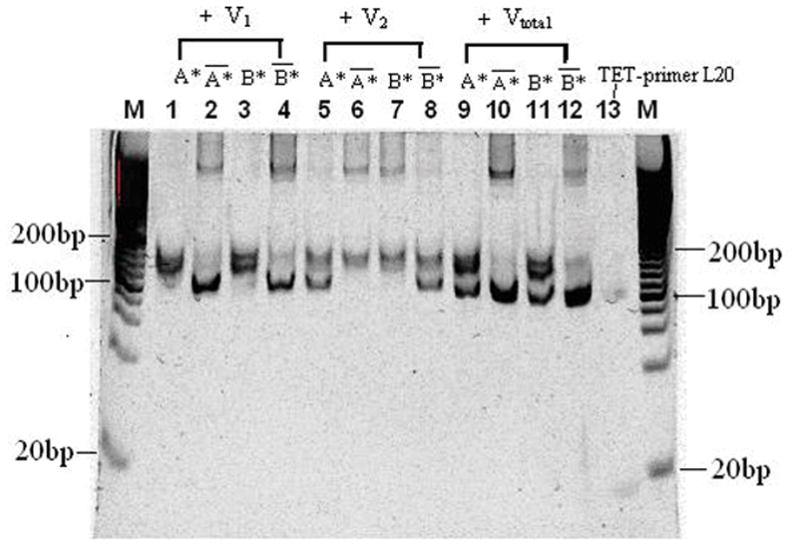
While remarkably complex networks of connected DNA molecules can form from a relatively small number of distinct oligomer strands, a large computational space created by DNA reactions would ultimately require the use of many distinct DNA strands. The automatic synthesis of this many distinct strands is economically prohibitive. We present here a new approach to producing distinct DNA oligomers based on the polymerase chain reaction (PCR) amplification of a few random template sequences. As an example, we designed a DNA template sequence consisting of a 50-mer random DNA segment flanked by two 20-mer invariant primer sequences. Amplification of a dilute sample containing about 30 different template molecules allows us to obtain around 10(11) copies of these molecules and their complements. We demonstrate the use of these amplicons to implement some of the vector operations that will be required in a DNA implementation of an analog neural network.


Figures

Figure 1
Figure 1
Gel electrophoresis of PCR amplifying random DNA sequence in a 10–20% gradient Tris-HCl polyacrylamide gel. Lane M contains 20bp DNA marker. Lanes 1 and 2 contain PCR amplicons of D-2. Lanes 3 and 4 contain PCR amplicons of D-3. Lanes 5 and 6 contain PCR amplicons of D-3.5. Lanes 7 and 8 contain PCR amplicons of D-4. Lanes 9 and 10 are controls without the initial DNA template. Lanes 11 and 12 are controls with sealed caps.
Figure 2
Figure 2
Gel electrophoresis of 30-cycle asymmetric PCR products at 107 volts and 40°C in a 15% TBE gel. Lane M contains 20bp DNA ladder. Lane 1 contains the products of template A and primer L20 only. Lane 2 contains template A and primer R20 only. Lane 3 contains the products of template B and primer L20 only. Lane 4 contains template B and primer R20 only. Lane 5 contains the product of template A and Tag-L20 only. Lane 6 contains the product of template A and Tag-R20 only. Lane 7 contains the product of template B and Tag-L20 only. Lane 8 contains the product of template B and Tag-R20 only. Lane 9 contains 10μL 0.5μM template 90-002.
Figure 3
Figure 3
Gel electrophoresis of purified ssDNA in a 15% TBE gel. Lane M contains 20 bp DNA ladder. Lanes 1, 2, 3, 4, 5, 6, 7 and 8 contain pure ssDNA samples from corresponding lanes of Fig. 2. Lane 9 contains 10μL 0.5μM template 90-002.
Figure 4
Figure 4
Calculated band concentration of purified ssDNA strands versus lane numbers. The standard Lane 9 has a concentration of 0.5μM.
Figure 5
Figure 5
Gel electrophoresis of DNA samples annealed at 37°C (a) and 60°C (b) in 15% TBE gels. Lane M contains 20bp DNA ladder. Lane 1 and 2 contains the annealing products of A and A-bar, B and B-bar respectively. Lane 3 contains the bubble DNA formed by annealing A and B-bar. Lane 4 contains ssDNA A and B. Lane 5 to 8 repeat lanes 1 to 4 by annealing with 30~40 mM NaCl.
Figure 6
Figure 6
Addition of two vectors using the representation in DNA basis vector space. Two basis vectors A and B are represented by DNA strands amplified by the asymmetric PCR. V1=A+0.5B, V2= −0.5 A +0.25B and Vtotal =0.5 A + 0.75B.
Figure 7
Figure 7
Fluorescence images of vectors using a 15mW 514 nm laser. The electrophoresis was run at 107V and 40°C for 80 minutes. (A) Lanes 1, 2, 3 and 4 show the fluorescence signal of V1 detected by using A*, A*-bar, B* and B*-bar respectively. Lanes 5, 6, 7 and 8 show the fluorescence signal of V2 detected by using A*, A*-bar, B* and B*-bar respectively. Lane 9, 10, 11 and 12 show the fluorescence signal of Vtotal by using A*, A*-bar, B* and B*-bar respectively. Lane 13 contains 3 pmoles of 22 bases TET primerL20. (B) The normalized intensities. Experimental results are V1=1A+0.62B, V2=−0.28A+0.25B and Vtotal=0.51A+0.88B obtained directly from the fluorescence signals. (C) The plot of theoretical value Vtotal=0.5A+0.75B, data from the numerical sum of the separate intensities measured for V1 and V2 and data from the DNA vector sum Vtotal.
Figure 7
Figure 7
Fluorescence images of vectors using a 15mW 514 nm laser. The electrophoresis was run at 107V and 40°C for 80 minutes. (A) Lanes 1, 2, 3 and 4 show the fluorescence signal of V1 detected by using A*, A*-bar, B* and B*-bar respectively. Lanes 5, 6, 7 and 8 show the fluorescence signal of V2 detected by using A*, A*-bar, B* and B*-bar respectively. Lane 9, 10, 11 and 12 show the fluorescence signal of Vtotal by using A*, A*-bar, B* and B*-bar respectively. Lane 13 contains 3 pmoles of 22 bases TET primerL20. (B) The normalized intensities. Experimental results are V1=1A+0.62B, V2=−0.28A+0.25B and Vtotal=0.51A+0.88B obtained directly from the fluorescence signals. (C) The plot of theoretical value Vtotal=0.5A+0.75B, data from the numerical sum of the separate intensities measured for V1 and V2 and data from the DNA vector sum Vtotal.
Figure 8
Figure 8
Gel images of vectors using 312 nm UV light after SYBR Gold gel stain. The electrophoresis was run at 107V and 40°C for 80 minutes. Lane M contains 20bp DNA ladder. Lanes 1, 2, 3 and 4 show the SYBR Gold signal of V1 with A*, A*-bar, B* and B*-bar respectively. Lanes 5, 6, 7 and 8 show the SYBR Gold signal of V2 with A*, A*-bar, B* and B*-bar respectively. Lanes 9, 10, 11 and 12 show the SYBR Gold signal of Vtotal with A*, A*-bar, B* and B*-bar respectively. Lane 13 contains 22 bases ssDNA TET-primerL20.

Similar articles

References

    1. Adleman LM. Molecular computation of solutions to combinatorial problems. Science. 1994;266:1021–1021. - PubMed
    1. Braich RS, Chelyapov N, Johnson C, Rothemund PWK, et al. Solution of a 20-Variable 3-SAT Problem on a DNA Computer. Science. 2002;296:499. - PubMed
    1. Winfree E, Liu FR, Wenzler LA, Seeman NC. Design and self-assembly of two-dimensional DNA crystals. Nature. 1998;394:539–544. - PubMed
    1. Seeman NC, Wang H, Yang XP, Liu FR, et al. New motifs in DNA nanotechnology. Nanotechnology. 1998;9:257–273.
    1. Liu QH, Wang LM, Frutos AG, Condon AE, et al. DNA computing on surfaces. Nature. 2000;403:175–179. - PubMed

Publication types