. 2009 Apr;48(4):366-80.
doi: 10.1002/gcc.20647.

Distinct genomic aberrations associated with ERG rearranged prostate cancer

Affiliations

Distinct genomic aberrations associated with ERG rearranged prostate cancer

Francesca Demichelis et al. Genes Chromosomes Cancer. 2009 Apr.

Abstract

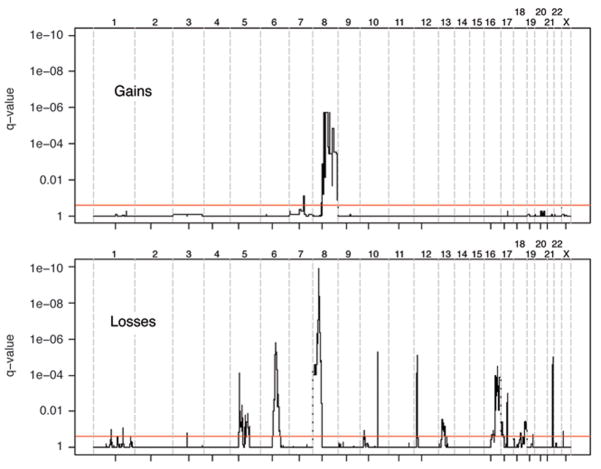
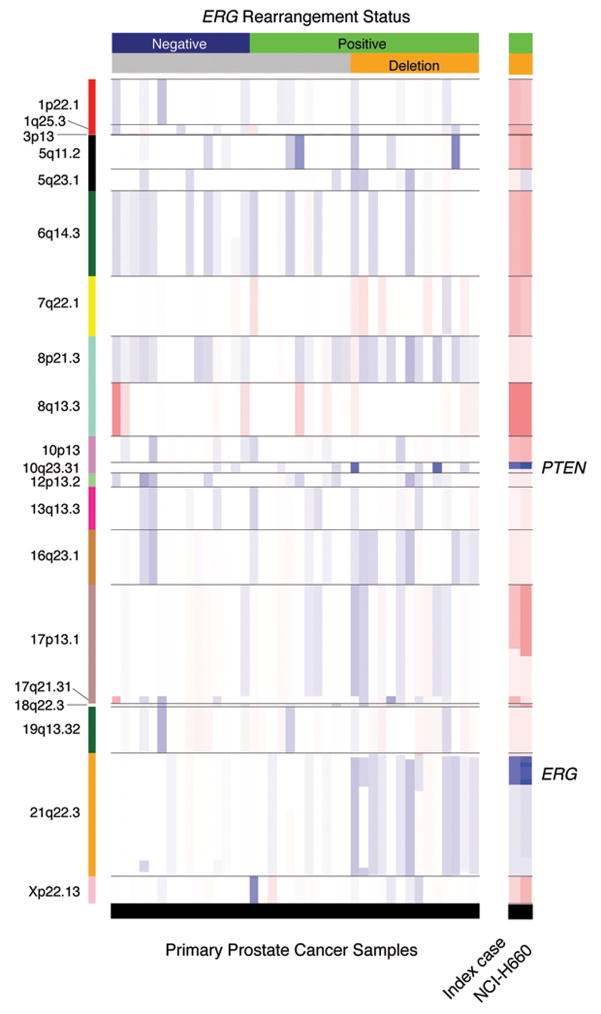
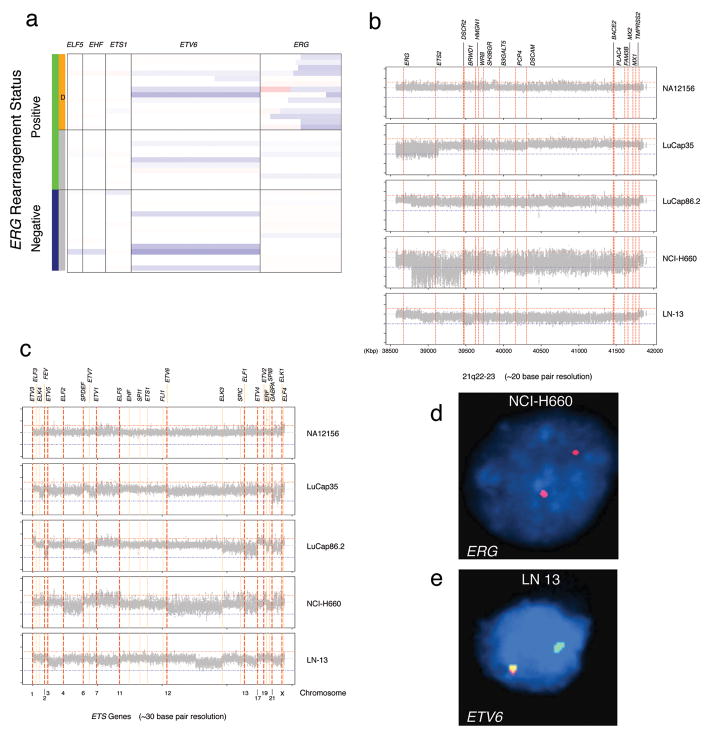
Emerging molecular and clinical data suggest that ETS fusion prostate cancer represents a distinct molecular subclass, driven most commonly by a hormonally regulated promoter and characterized by an aggressive natural history. The study of the genomic landscape of prostate cancer in the light of ETS fusion events is required to understand the foundation of this molecularly and clinically distinct subtype. We performed genome-wide profiling of 49 primary prostate cancers and identified 20 recurrent chromosomal copy number aberrations, mainly occurring as genomic losses. Co-occurring events included losses at 19q13.32 and 1p22.1. We discovered three genomic events associated with ERG rearranged prostate cancer, affecting 6q, 7q, and 16q. 6q loss in nonrearranged prostate cancer is accompanied by gene expression deregulation in an independent dataset and by protein deregulation of MYO6. To analyze copy number alterations within the ETS genes, we performed a comprehensive analysis of all 27 ETS genes and of the 3 Mbp genomic area between ERG and TMPRSS2 (21q) with an unprecedented resolution (30 bp). We demonstrate that high-resolution tiling arrays can be used to pin-point breakpoints leading to fusion events. This study provides further support to define a distinct molecular subtype of prostate cancer based on the presence of ETS gene rearrangements.


Figures

Figure 1
Figure 1. Genomic aberrations in primary prostate cancers as evaluated on a collection of 49 samples
The red lines identify q-values of 0.25 as cut-off for significance. Q-values are plotted along the genomic location, with chromosomes delineated by vertical dotted lines and centromeres by small marks. The top frame refers to gains (amplification) and the lower frame to losses (deletions).
Figure 2
Figure 2. Smoothed segmented copy number data of recurrent lesions
The heatmap shows log2 intensity ratios within the detected recurrent lesions (annotated by chromosome band on the left side). The 40 prostate cancer samples harboring the recurrent lesions are presented, ordered based on ERG rearrangement status (upper horizontal bar) and by deletion status of ERG telomeric probe as assessed by dual-color FISH. The right hand profiles show the genomic status of the same regions in NCI-H660 cell line and in the corresponding index case (prostate cancer metastasis). Red and blue colors indicate gains and losses, respectively. Color intensity corresponds to copy number change amplitude. White indicates no change.
Figure 3
Figure 3. ERG rearranged prostate cancer lesions
A, Binary representation of three genomic recurrent lesions associated with ERG rearranged prostate cancer (gray indicates absence, black indicates presence of lesion). The samples are sorted by ERG rearrangement status and annotated for deletion status of ERG telomeric probe as assessed by dual-color FISH. B, Distributions of transcript expression of SNX14, MCM7, and MAF genes in two sets of ERG rearranged negative and ERG rearranged positive prostate cancers as determined by expression profiling. The genes were selected as centrally located in the three fusion associated lesions. C, Monoallelic deletion for SNX14 in primary prostate cancer cell as determined by FISH. A representative tumor nucleus demonstrates the loss of a red probe at 6q14.3.
Figure 4
Figure 4. Chromosomal arm enrichment for ERG rearrangement related genes
Two prostate cancer gene expression datasets annotated for ERG rearrangement by FISH analysis were analyzed and compared with genomic aberrations. A, ERG rearrangement enrichment scores derived by gene expression data are presented on y-axis for p and q arms for each chromosome (x-axis). Maximum enrichment score occurs when all genes on a specific arm are associated with rearrangement status. The two cohorts (see text for details) are color coded and directionality of deregulation versus rearrangement status is represented by up and down arrows. Significant p-values, evaluated by the Hypergeometric distribution, are shown. Significant enrichment scores for over-expression were detected for 2p (SW, p<0.009), 6p (PHS, p<0.009), 6q (SW, p<0.009 and PHS, p<0.01), and 14q (SW, p<0.001). Significant enrichment scores for under-expression are detected on 18p (PHS, p<0.03), and 21q (PHS, q<0.04). Interestingly, the 6q arm is consistently scored significant for enrichment of up-regulated rearrangement-related genes in the two cohorts and was shown to harbor a genomic deletion in fusion negative cancers. B. MYO6 (Myosin VI) located 6q14.1 and deregulated in rearrangement positive cancers (see boxplot, left). C. We observed a direct association between over-expression of MYO6 protein (immunohistochemistry evaluation on a tissue microarray, right) and ERG rearrangement status (Fisher exact test p-value = 0.04).
Figure 5
Figure 5. Genomic aberrations of ETS genes
A. 250K Sty SNP Array data for a subset of ETS genes, (i.e., ELF5, EHF, ETS1, ETV6, and ERG) are presented. ETV6 undergoes hemizygous deletion in about 25% of prostate cancers. ERG is represented by 31 SNP markers and demonstrates an interstitial genomic lesion in approximately half of ERG rearranged prostate cancers. B-C. Custom ETS gene tiling arrays with one marker every 20–30bp were used on four prostate cancer samples. Smoothed log2 ratio signals for the four prostate cancer samples and one control (top frames) demonstrate the heterogeneity of the interstitial deletion between ERG and TMPRSS2 as seen in panel B. LuCap35 is characterized by homozygous deletion of ERG and of centromeric portion of ETS2 (39,150Kb) and by hemizygous deletion from ETS2 to PCP4 (Purkinje cell protein 4) (from 39,150Kb to 40,320Kb). The NCI-H660 cell line shows homozygous deletion starting at exon 4 of ERG to ETS2 (from 38,786Kb to 39,440Kb), followed by hemizygous deletion to TMPRSS2. The homozygous deletion observed in NCI-H660, was confirmed by FISH (D). In panel C, the remaining ETS genes were analyzed. We observed that the hormone naïve metastatic lymph node sample (LN13) demonstrated a partial deletion of ETV6, the second most commonly altered ETS gene, starting at 11,813,084bp (chromosome 12). FISH analysis validated the deletion of the telomeric end of ETV6 (E). In addition to ERG, ETS2, and ETV6, we observed aberrations of other ETS genes (i.e., FEV, ELF1, and ERF).

References

    1. Alers JC, Krijtenburg PJ, Vis AN, Hoedemaeker RF, Wildhagen MF, Hop WC, van Der Kwast TT, Schroder FH, Tanke HJ, van Dekken H. Molecular cytogenetic analysis of prostatic adenocarcinomas from screening studies: early cancers may contain aggressive genetic features. Am J Pathol. 2001;158:399–406. - PMC - PubMed
    1. Ambs S, Prueitt RL, Yi M, Hudson RS, Howe TM, Petrocca F, Wallace TA, Liu CG, Volinia S, Calin GA, Yfantis HG, Stephens RM, Croce CM. Genomic profiling of microRNA and messenger RNA reveals deregulated microRNA expression in prostate cancer. Cancer Res. 2008;68:6162–6170. - PMC - PubMed
    1. Amin MB, Grignon DJ, Humphrey PA, Srigley JR. Gleason Grading of Prostate Cancer: a contemporary approach. 1. Philadelphia: Lippincott Williams and Wilkins; 2003. p. 116.
    1. Attard G, Clark J, Ambroisine L, Fisher G, Kovacs G, Flohr P, Berney D, Foster CS, Fletcher A, Gerald WL, Moller H, Reuter V, De Bono JS, Scardino P, Cuzick J, Cooper CS. Duplication of the fusion of TMPRSS2 to ERG sequences identifies fatal human prostate cancer. Oncogene. 2008;27:253–263. - PMC - PubMed
    1. Beroukhim R, Getz G, Nghiemphu L, Barretina J, Hsueh T, Linhart D, Vivanco I, Lee JC, Huang JH, Alexander S, Du J, Kau T, Thomas RK, Shah K, Soto H, Perner S, Prensner J, Debiasi RM, Demichelis F, Hatton C, Rubin MA, Garraway LA, Nelson SF, Liau L, Mischel PS, Cloughesy TF, Meyerson M, Golub TA, Lander ES, Mellinghoff IK, Sellers WR. Assessing the significance of chromosomal aberrations in cancer: Methodology and application to glioma. Proc Natl Acad Sci U S A. 2007;104:20007–20012. - PMC - PubMed

Publication types