. 2009 Mar;109(4):312-25.
doi: 10.1016/j.ultramic.2008.12.006. Epub 2008 Dec 11.

Practical factors affecting the performance of a thin-film phase plate for transmission electron microscopy

Affiliations

Practical factors affecting the performance of a thin-film phase plate for transmission electron microscopy

Radostin Danev et al. Ultramicroscopy. 2009 Mar.

Abstract

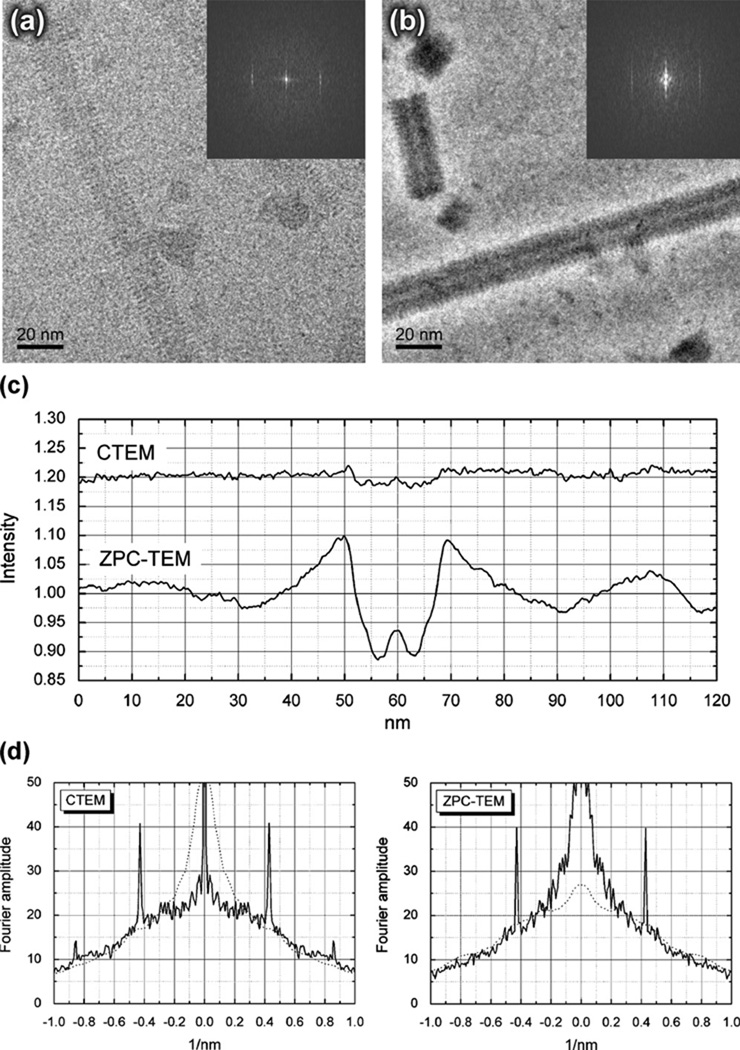
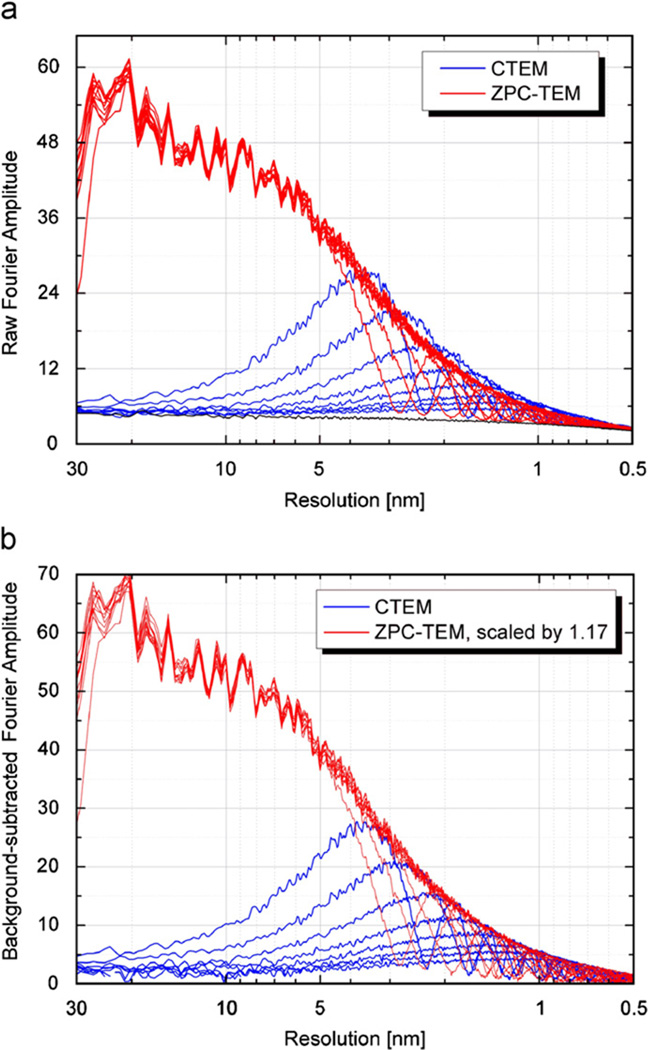
A number of practical issues must be addressed when using thin carbon films as quarter-wave plates for Zernike phase-contrast electron microscopy. We describe, for example, how we meet the more stringent requirements that must be satisfied for beam alignment in this imaging mode. In addition we address the concern that one might have regarding the loss of some of the scattered electrons as they pass through such a phase plate. We show that two easily measured parameters, (1) the low-resolution image contrast produced in cryo-EM images of tobacco mosaic virus particles and (2) the fall-off of the envelope function at high resolution, can be used to quantitatively compare the data quality for Zernike phase-contrast images and for defocused bright-field images. We describe how we prepare carbon-film phase plates that are initially free of charging or other effects that degrade image quality. We emphasize, however, that even though the buildup of hydrocarbon contamination can be avoided by heating the phase plates during use, their performance nevertheless deteriorates over the time scale of days to weeks, thus requiring their frequent replacement in order to maintain optimal performance.


Figures

Fig. 1
Fig. 1
Schematic diagram of a cross-section through the central hole in a thin carbon-film phase plate. The various features included in this diagram are not shown to scale, but the crucial dimensions are indicated in the figure. The dark rectangles represent the edges of the aperture, and a hypothetical patch of contamination, of unknown origin, is indicated on the under side of the phase plate. The initial, ~17-nm-thick core of evaporated carbon is shown in dark gray, and the thinner ~5-nm-thick finishing layer, or “wrap” of evaporated carbon, is shown in light gray.
Fig. 2
Fig. 2
Photograph of the tip of the aperture rod used for the heated phase plate. A 7 × 7 array of thin-film phase plates, supported on specially manufactured, multihole molybdenum disks (Daiwa Techno Systems, Tokyo), are clamped into the end of the aperture rod. The ceramic heater is mounted below a metal shielding plate, and the “near” end of the thermal insulator is also enclosed by a metal shield.
Fig. 3
Fig. 3
Example of a measurement of the thickness of a carbon-film phase plate. The thickness measurement is made in areas of an aperture disc where one or another phase plate was damaged during handling, and the “wrapped” carbon film is thus folded upon itself. Such folds are measured at the point where the image shows the narrowest profile, as is indicated by the annotations placed on this image. The error in measuring the total thickness is estimated to be less than 1–2 nm.
Fig. 4
Fig. 4
Measurement of the intensity transmittance of a representative carbon-film phase plate. (a) Image of a 25-nm-thick carbon-film phase plate. This image was recorded at a magnification of ~33,000 on the CCD camera. The slit width of the energy filter that was used when recording this image corresponded to an energy loss of 5 eV, and the slit was centered on the position of the zero-loss peak. The image was recorded in a close-to-focus condition, and a 5 µm aperture was used in the objective lens. (b) Intensity trace across the edge of the hole in the phase plate. The correspondence between positions in the image and positions in the line-trace is indicated by the arrows that are shown between panels (a) and (b). Note the very slight decrease in intensity close to the edge of the hole, which may reflect as much as a ~1.5-nm-thick layer of contamination that has built up in this area during use.
Fig. 5
Fig. 5
Dependence of the initially “constant” value of the CTF on the thickness of a thin-film phase plate, shown only for thickness values within ±20% of the thickness for which the phase shift is 90°, τ90. The initially constant value of the CTF (see Eq. (1) and also Fig. 6) is shown as a function of the dimensionless thickness, expressed in units of τ90. The calculation for a lossy phase plate assumed that the mean free path for electron loss is 115 nm, corresponding to the value we measured for 300 kV electrons. The corresponding calculation for a lossless phase plate is shown in order to aid a comparison of the relative contributions made by electron loss and by failure to produce exactly a 90° phase shift. The calculated values assume that the initial cut-on frequency is low enough to not reduce the value of the CTF.
Fig. 6
Fig. 6
Optimization of the thickness of a carbon-film phase plate according to different assumptions. (a) Theoretical CTF curves for a 300 kV microscope with Cs = 5mm. The solid line is the CTF for a phase plate that produces a 90° phase shift. The dotted line is the CTF calculated for the case in which one is willing to accept reduced contrast at the lowest frequencies by using a phase plate that is only thick enough to produce a 45° phase shift. An optimal amount of defocus is then used to obtain a larger phase shift at higher resolution. The dashed line is the CTF for a phase plate that is “optimized” for use with a mixed phase and amplitude object in which the amplitude contrast is ~7% of the phase contrast. (b) Thickness values for carbon-film phase plates that are optimized for three conditions: 90° phase shift (lossless phase plate)—solid line; lossy phase plate—dashed line; and a lossy phase plate used to image an object in which the amplitude contrast is ~7% of the phase-contrast—dotted line.
Fig. 7
Fig. 7
Examples of how various parameters can be optimized to best suit the particle size of a given biological specimen. (a) The image intensity obtained in the simulation of a phase disk, calculated as a function of the object phase, i.e. the phase modulation in the exit wave below the disk. Curves are shown for four examples of the phase shift applied by an ideal Zernike phase plate (infinitely small hole). Two analytical approximations for the image intensity are also shown, both of which assume that the phase shift applied by the Zernike phase plate is π/2. The dotted straight line shows the intensity expected for a weak-phase object, while the red curve shows the analytical approximation when the image intensity is expanded to fourth order in the object phase. (b) The image intensity obtained in the simulations for a phase disk, shown in this case as a function of the phase shift applied by an ideal Zernike phase plate. In this case there are four pairs of curves, each pair representing a different value of the phase modulation of the exit wave. The member of each pair of curves that is shown in black assumes that there is no loss of electrons as they pass through the phase plate, while the second member, shown in red, assumes that the mean free path for loss of electrons is 115 nm. (c) The contrast calculated for simulated images of uniform spheres is shown as a function of the cut-on periodicity (reciprocal of the cut-on frequency) of a Zernike phase plate. The contrast in this case is defined as the difference in intensity between the center of the object and the background, divided by the intensity of the background. The phase plate is assumed to apply a phase shift of 90°. The contrast at the center of the particle falls to zero when the cut-on period approaches the diameter of the sphere, and the contrast then oscillates in sign as the cut-on period decreases further.
Fig. 8
Fig. 8
Phase-contrast images of four representative cryo-EM specimens. Note that the magnification in (c) and (d) is twice that in (a) and (b). (a) E.coli GroEL, a ~800 kDa homo-oligomer consisting of 14 subunits arranged in two stacked rings, with each ring containing seven copies of the protein. Similar micrographs, and a three-dimensional reconstruction obtained from such images, have been published previously [10]. (b) Liposomes prepared from egg-yolk phosphatidylcholine that were mixed with lambda phage DNA. Many of the DNA molecules are adsorbed to the surfaces of the liposomes, while others form numerous bridges between adjacent liposomes. A more extensive description of phase-contrast imaging of this sample is given in [28]. (c) Desulfovibrio vulgaris dissimilatory sulfite reductase (Dsr), a 200 kDa dimer of heterotrimers. (d) Helicobacter pylori VacA toxin, an 88 kDa protein that assembles into pinwheel-shaped rings (both complete and incomplete forms are seen here), and non-chiral double-layered rings [29]. These four examples are representative of the diverse range of macromolecular particles that can be studied by phase-contrast electron microscopy.
Fig. 9
Fig. 9
Quantitative measurement of the increased visibility (contrast) achieved in cryo-EM images of tobacco mosaic virus (TMV) when using a thin-film phase plate with a cut-on periodicity of about 40 nm. (a) Bright-field image of TMV particles recorded at a defocus of ~1 µm. A gray-scale representation of the modulus of the Fourier transform of a narrowly boxed section of virus, 157 nm in length, is shown in the inset. (b) Phase-contrast image recorded in a close-to-focus condition. A gray-scale representation of the modulus of the Fourier transform of an identically boxed section of virus is again shown in the inset. (c) Intensity profiles across the images of virus particles shown in panels (a) and (b), respectively. The intensity profiles for the virus particles are averaged along a length of 85 nm in a direction parallel to the axis of the virus. For clarity, the averaged profile for the bright-field image of the virus is off set vertically from that for the phase-contrast image by 0.2 units. In the case of the phase-contrast image, the intensity within the virus decreases to about ~0.90 of that in the surrounding ice, whereas in the case of the defocused bright-field image the intensity within the virus decreases to only about 0.98 of that in the surrounding ice. (d) One-dimensional representations of the Fourier-amplitude spectra shown as insets in panels (a) and (b), obtained by projecting the amplitude spectra in a direction parallel to the layer lines. A smoothed version of the curve (with the diffraction peak removed) for the CTEM image is shown as a dotted curve in the panel for the ZPC-TEM image, and similarly a smoothed version of the curve for the ZPC-TEM image is shown as a dotted line in the panel for the CTEM image. The peak heights of the averaged Fourier amplitudes on the 2.3 nm layer line are seen to be much more similar than might have been estimated from the gray-scale representations shown in (a) and (b). The strong Fourier amplitudes that are retained at a resolution below ~1/(5 nm) in the Zernike phase-contrast image make it difficult to compare the gray-scale representations of the two spectra. The slight reduction of the envelope of the phase-contrast image relative to that of the bright-field image is thought to be due to loss of some electrons that pass through the phase plate—see Fig. 10 for additional information on this point.
Fig. 10
Fig. 10
Comparison of the circularly averaged Fourier-amplitude spectra of images of a 10-nm-thick carbon film recorded over a range of defocus values when using the “conventional” bright-field mode (blue curves), and when using the Zernike phase-contrast aperture (red curves). All images were recorded with identical illumination conditions and exposure times, and all Fourier transforms were computed for images of the same area of the specimen. Irregular oscillations in the low-resolution part of the amplitude spectra of the phase-contrast images reflect statistical variations in the circular average of the structure factors within the chosen area of the specimen, and should not be confused with noise in the measurement. The cut-on periodicity for the phase plate used in this experiment was ~28 nm, corresponding to a hole diameter of ~700 nm. The base-line spectrum (lowest curve in panel a) is that of an image of a hole in the specimen, i.e. it represents the modulus of the Fourier transform when the input image is a uniform field of randomly distributed electrons. (a) Representative Fourier-amplitude spectra obtained with a phase-contrast aperture (red curves) are compared to those obtained without an aperture (dark blue curves). (b) Background-subtracted versions of the same Fourier-amplitude spectra that are shown in (a). The background was subtracted in quadrature, i.e. the power spectrum of an “image” with no specimen was subtracted from the power spectra of the images of carbon film. The Fourier-amplitude spectra shown in this panel were then obtained by taking the square root of the background-subtracted power spectra. The respective CTF envelopes for phase-contrast and bright-field images are well superimposed when the background-subtracted amplitude spectra of phase-contrast images are multiplied by a factor of 1.17.

References

    1. Boersch H. Zeitschrift Fur Naturforschung Section a—a Journal of Physical Sciences. 1947;2:615.
    1. Schultheiss K, Perez-Willard F, Barton B, Gerthsen D, Schroder RR. Review of Scientific Instruments. 2006:77.
    1. Majorovits E, Barton B, Schultheiss K, Perez-Willard F, Gerthsen D, Schroder RR. Ultramicroscopy. 2007;107:213. - PubMed
    1. Cambie R, Downing KH, Typke D, Glaeser RM, Jin J. Ultramicroscopy. 2007;107:329. - PubMed
    1. Danev R, Nagayama K. Ultramicroscopy. 2001;88:243. - PubMed

Publication types

MeSH terms

LinkOut - more resources