. 2009 Apr;29(7):1855-68.
doi: 10.1128/MCB.01386-08. Epub 2009 Jan 21.

Cold-inducible RNA-binding protein bypasses replicative senescence in primary cells through extracellular signal-regulated kinase 1 and 2 activation

Affiliations

Cold-inducible RNA-binding protein bypasses replicative senescence in primary cells through extracellular signal-regulated kinase 1 and 2 activation

Ana Artero-Castro et al. Mol Cell Biol. 2009 Apr.

Abstract

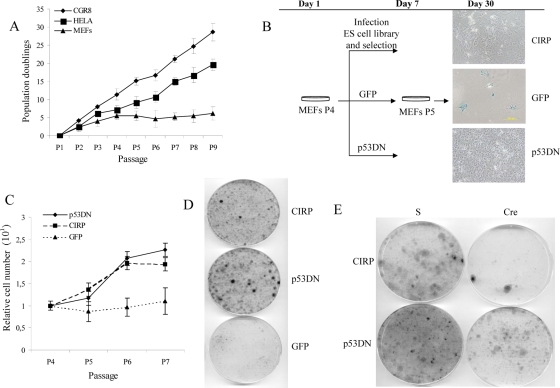
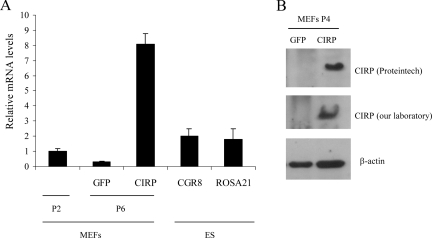
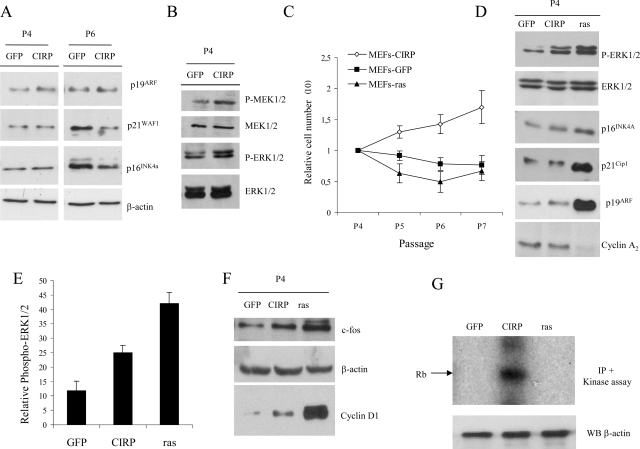
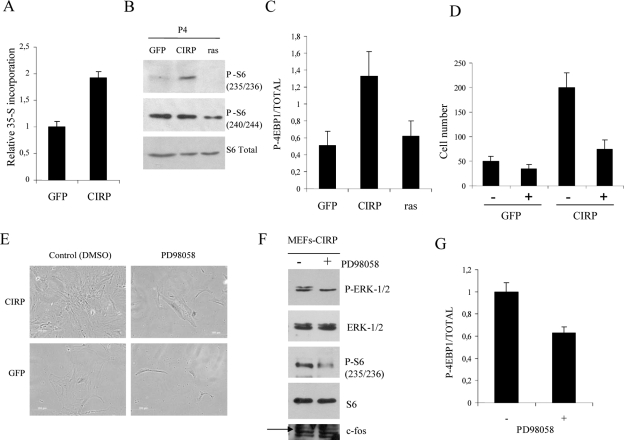
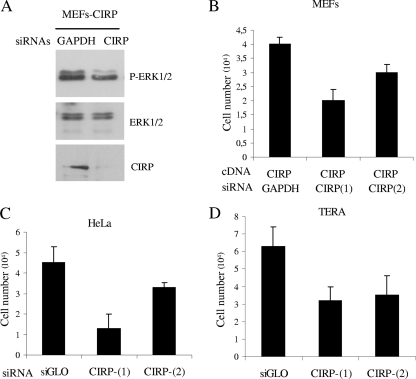
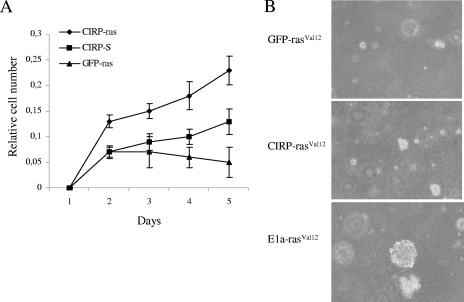
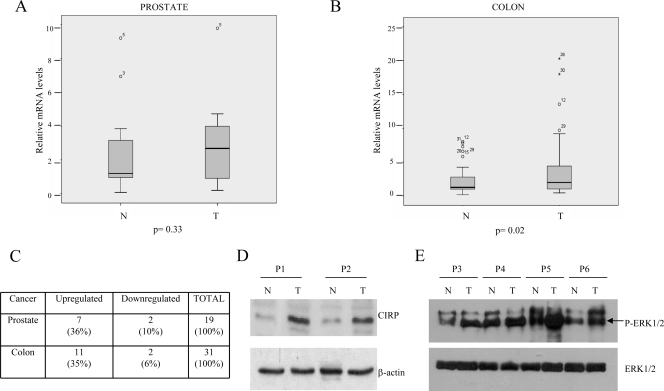
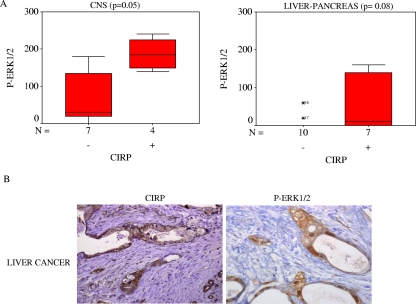
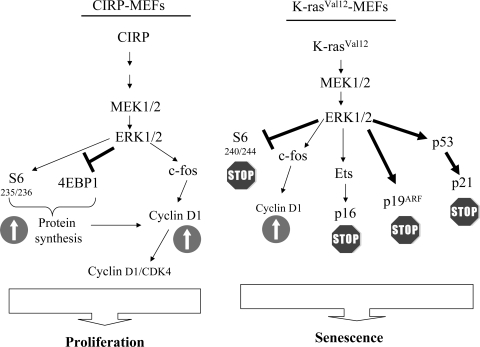
Embryonic stem cells are immortalized cells whose proliferation rate is comparable to that of carcinogenic cells. To study the expression of embryonic stem cell genes in primary cells, genetic screening was performed by infecting mouse embryonic fibroblasts (MEFs) with a cDNA library from embryonic stem cells. Cold-inducible RNA-binding protein (CIRP) was identified due to its ability to bypass replicative senescence in primary cells. CIRP enhanced extracellular signal-regulated kinase 1 and 2 (ERK1/2) phosphorylation, and treatment with an MEK inhibitor decreased the proliferation caused by CIRP. In contrast to CIRP upregulation, CIRP downregulation decreased cell proliferation and resulted in inhibition of phosphorylated ERK1/2 inhibition. This is the first evidence that ERK1/2 activation, through the same mechanism as that described for a Val12 mutant K-ras to induce premature senescence, is able to bypass senescence in the absence of p16(INK4a), p21(WAF1), and p19(ARF) upregulation. Moreover, these results show that CIRP functions by stimulating general protein synthesis with the involvement of the S6 and 4E-BP1 proteins. The overall effect is an increase in kinase activity of the cyclin D1-CDK4 complex, which is in accordance with the proliferative capacity of CIRP MEFs. Interestingly, CIRP mRNA and protein were upregulated in a subgroup of cancer patients, a finding that may be of relevance for cancer research.


Figures

FIG. 1.
FIG. 1.
CIRP bypasses replicative senescence in primary MEFs. (A) Growth curve of CGR8 ES cells versus HeLa cancer cells or primary MEFs following a 3T3 protocol. Passage number versus population doublings are represented in the graph. (B) Design of the experimental protocol performed in MEFs to carry on the genetic screen. β-Galactosidase staining was performed in GFP-, CIRP-, and p53DN-expressing MEFs at P6. Note the presence of β-galactosidase-positive cells (blue) only in GFP MEFs and their correlation with the characteristic cell morphology of senescent cells. (C) Growth curve of MEF cells after infection and selection of the indicated genes after performing a 3T3 protocol. The relative number of cells is considered a measure of the number of cells per passage relative to the initial number of cells seeded per plate. Negative and positive controls of proliferation, the GFP and p53DN genes, respectively, were included. (D) Colony formation assay. MEF cells after infection and selection of the indicated genes were seeded at a density of 105 cells per 10-cm plate and allowed to grow for 15 to 20 days. Finally, they were stained with crystal violet to observe the colonies formed from individual cells. (E) MEF cells were infected with a retroviral vector carrying CIRP plus the Cre cDNA or with the empty vector designated S. In parallel, a positive control of proliferation is shown (p53DN).
FIG. 2.
FIG. 2.
CIRP expression in various cell lines. (A) MEF cells were infected with a retroviral vector carrying the indicated genes, selected with appropriate antibiotics, and after selection were split following a 3T3 protocol. At P6 when clear phenotypic characteristics distinguish GFP- from CIRP-expressing cells, RNA was extracted to perform quantitative real-time PCR. Primary MEFs at early passage (P2) were also included, and ES cell lines CGR8 and ROSA 21 are shown as positive controls of CIRP expression as the original cDNA library was from both ES cell lines. (B) Duplicate dishes from CIRP- and GFP-expressing MEFs were kept for protein extraction. An immunoblot with anti-CIRP antibody is shown with two independent CIRP antibodies (one from Proteintech and the other generated in our laboratory). β-Actin is shown as loading control.
FIG. 3.
FIG. 3.
Cell cycle proteins during senescence. (A) MEF cells were infected with the indicated genes, selected with appropriate antibiotics, and, after selection, were split following a 3T3 protocol. Immunoblot of CIRP MEFs versus GFP MEFs with antibodies to p16INK4a, p19ARF, and p21WAF1 at P4 and in later passage when GFP vector-infected cells reached a clear senescence morphology (P6). (B) Immunoblot of CIRP and GFP MEFs with P-ERK1/2 and P-MEK1/2 antibodies; total ERK1/2 and MEK1/2 are shown as loading controls. (C) Growth curve of GFP, CIRP, and K-rasVal12 MEFs after following a 3T3 protocol. Cells were counted at different passages, and relative cell numbers are shown. The relative number of cells is considered a measure of the number of cells per passage relative to the initial number of cells seeded per plate. (D) Immunoblot of CIRP, GFP, and K-rasVal12 MEFs with antibodies to p21WAF1, p19ARF, p16INK4a, and cyclin A2. Total ERK1/2 is shown as a loading control. (E) P-ERK1/2 quantification versus total ERK1/2 in CIRP and K-rasVal12 MEFs. Results represent the mean of three independent experiments. (F) Immunoblot of CIRP, GFP, and K-rasVal12 MEFs with antibodies to c-fos and cyclin D1. β-Actin is shown as loading control. (G) Kinase assay in CIRP, K-rasVal12, and GFP MEFs. CIRP MEFs exhibit high kinase activity compared to senescent cells, either by replicative senescence (GFP) or by oncogene-induced senescence (K-rasVal12). β-Actin is shown as a loading control from the same supernatants of the kinase assay samples. IP, immunoprecipitation; WB, Western blotting.
FIG. 4.
FIG. 4.
CIRP increases protein synthesis. (A) MEF cells were infected with the indicated genes and selected with appropriate antibiotics. After selection they were seeded at 105 cells per well in a 24-well plate. The following day, [35S]methionine was added to the culture medium and incubated for 2 h. The graph shows [35-S]methionine incorporation in CIRP MEFs relative to GFP MEFs as a measurement of general protein synthesis. (B) MEF cells were infected with the indicated genes and selected with appropriate antibiotics. After selection, protein extracts were collected for immunoblotting with S6 ribosomal protein and an antibody that recognizes its phosphorylation (P-S6) at positions 235/236 and 240/244. (C) Relative quantification of P-4E-BP1 protein at positions Thr 37/46, total 4E-BP1 in CIRP MEFs, and two negative controls of proliferative GFP and K-rasVal12 MEFs. Results represent the mean of three independent experiments. The bands of the immunoblot were quantified by specific software (Quantity One). (D) MEF cells were infected with the indicated genes and selected with appropriate antibiotics. After selection, they were seeded at 105 cells per well in a 24-well plate. Cell number after treatment of CIRP MEFs compared to GFP MEFs at P4 with the MEK inhibitor PD98058 for 1 week is shown. (E) The MEK inhibitor PD98058 is able to reverse the proliferative phenotype in CIRP MEFs, but it does not affect GFP MEFs. (F) MEF cells were infected with CIRP, selected with appropriate antibiotics, and further seeded at a density of 0.5 × 10⁶ cells per 10-cm plate. Two plates were treated with PD98058 and compared to control plates (dimethyl sulfoxide [DMSO]). Protein extracts were collected for immunoblotting of P-ERK1/2, ERK1/2, P-S6 235/236, S6, and c-fos. (G) Relative quantification of P-4E-BP1 protein at positions Thr 37/46 compared to total 4E-BP1 in CIRP MEFs treated with the MEK inhibitor PD98058 from the same experiment as in panel F. All experiments were performed independently at least two times.
FIG. 5.
FIG. 5.
CIRP downregulation in various cell lines. (A) Immunoblot of P-ERK1/2, ERK1/2, and CIRP (our laboratory) from MEF cells transfected with the CIRP(1) siRNA. (B) MEFs cells at P4 were infected with a vector carrying CIRP cDNA and selected with appropriate antibiotics. Then, cells were counted and inversely transfected with Hyperfect reagent at a density of 10 × 103 to 25 × 103 cells per well in a 24-well plate. Two different siRNAs against CIRP were used and compared to a neutral siRNA against GAPDH. Cells were counted 5 days after transfection with an inverted microscope using a hemocytometer (viability determined by trypan blue exclusion). (C) Cell number of HeLa cells after transient transfection with two different CIRP siRNAs compared to neutral siRNA (siGLO). (D) Cell number of TERA cells after transient transfection of two different CIRP siRNAs compared to neutral siRNA (siGLO). siRNA results from two independent experiments are shown for all cell lines.
FIG. 6.
FIG. 6.
CIRP is not involved in transformation. (A) MEF cells were infected with a retroviral vector carrying CIRP and compared to those with GFP cDNAs. The cells were selected with appropriate antibiotics and coinfected with retroviruses expressing an empty vector (S) or K-rasVal12. Cells were selected again with appropriate antibiotics. Then, 105 cells were seeded in the wells of 24-well plates and fixed daily for 5 days. Finally, they were stained with crystal violet and destained with 10% acetic acid. Absorbance measurement at 595 nm was used as an indicator of the relative number of cells. (B) Soft-agar assay using GFP-rasVal12 and E1a-rasVal12 as negative and positive controls, respectively, of proliferation. K-rasVal12 does not contribute to transformation in CIRP MEF cells as no clear colonies were observed in medium containing agar.
FIG. 7.
FIG. 7.
CIRP expression in prostate and colon tumors. (A) Average of mRNA levels quantified by real-time PCR in 19 prostate carcinomas. N, normal; T, tumor. (B) Average of mRNA levels quantified by real-time PCR in 31 colon carcinomas. (C) Summary of all patients analyzed by quantitative real-time PCR. (D) Immunoblot of the CIRP protein in two patients with colon carcinoma. A total of 250 μg of total protein extract was used. (E) Example of a P-ERK1/2 immunoblot in four patients where CIRP was upregulated (P3, P4, and P5, patients with colon cancer; P6, patient with prostate cancer).
FIG. 8.
FIG. 8.
Concomitant CIRP and P-ERK expression in human tumors. (A) A Mann-Whitney U test was used to validate the correlation of CIRP and P-ERK1/2 proteins detected by immunohistochemistry from patients with cancer of the central nervous system (n = 11 patients) and liver-pancreas (n = 17 patients). (B) Example of immunohistochemistry of CIRP and P-ERK1/2 proteins in the tumor from a patient with liver cancer.
FIG. 9.
FIG. 9.
Proposed model to explain why CIRP and K-rasVal12 genes evolve into different cell responses upon activation with the same MAPK cascade. In CIRP-expressing MEFs, the proliferative signals driven mainly by P-S6, P-4E-BP1, and c-fos activate cyclin D1 and its associated kinase activity. Although the same MAPK pathway is activated in K-rasVal12 MEFs, major inhibitory signals are present that are driven by the proteins p19ARF, p21WAF1, and p16INK4a. These proteins dictate a different cell fate.

References

    1. Armengol, G., F. Rojo, J. Castellvi, C. Iglesias, M. Cuatrecasas, B. Pons, J. Baselga, and S. Ramon y Cajal. 2007. 4E-binding protein 1: a key molecular “funnel factor” in human cancer with clinical implications. Cancer Res. 677551-7555. - PubMed
    1. Bernard, S. A., T. W. Gray, M. D. Buist, B. M. Jones, W. Silvester, G. Gutteridge, and K. Smith. 2002. Treatment of comatose survivors of out-of-hospital cardiac arrest with induced hypothermia. N. Engl. J. Med. 346557-563. - PubMed
    1. Brown, J. R., E. Nigh, R. J. Lee, H. Ye, M. A. Thompson, F. Saudou, R. G. Pestell, and M. E. Greenberg. 1998. Fos family members induce cell cycle entry by activating cyclin D1. Mol. Cell. Biol. 185609-5619. - PMC - PubMed
    1. Burdon, T., A. Smith, and P. Savatier. 2002. Signalling, cell cycle and pluripotency in embryonic stem cells. Trends Cell. Biol. 12432-438. - PubMed
    1. Carnero, A., J. D. Hudson, C. M. Price, and D. H. Beach. 2000. p16INK4A and p19ARF act in overlapping pathways in cellular immortalization. Nat. Cell Biol. 2148-155. - PubMed

Publication types

MeSH terms