. 2009 Jan 21;29(3):600-9.
doi: 10.1523/JNEUROSCI.3481-08.2009.

HCN1 channel subunits are a molecular substrate for hypnotic actions of ketamine

Affiliations

HCN1 channel subunits are a molecular substrate for hypnotic actions of ketamine

Xiangdong Chen et al. J Neurosci. .

Abstract

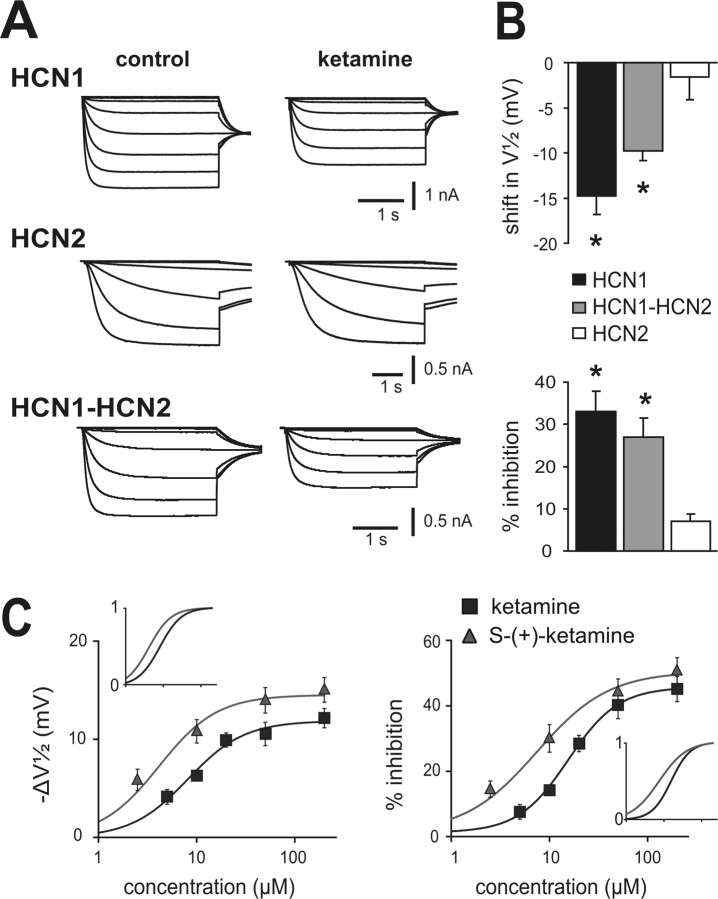
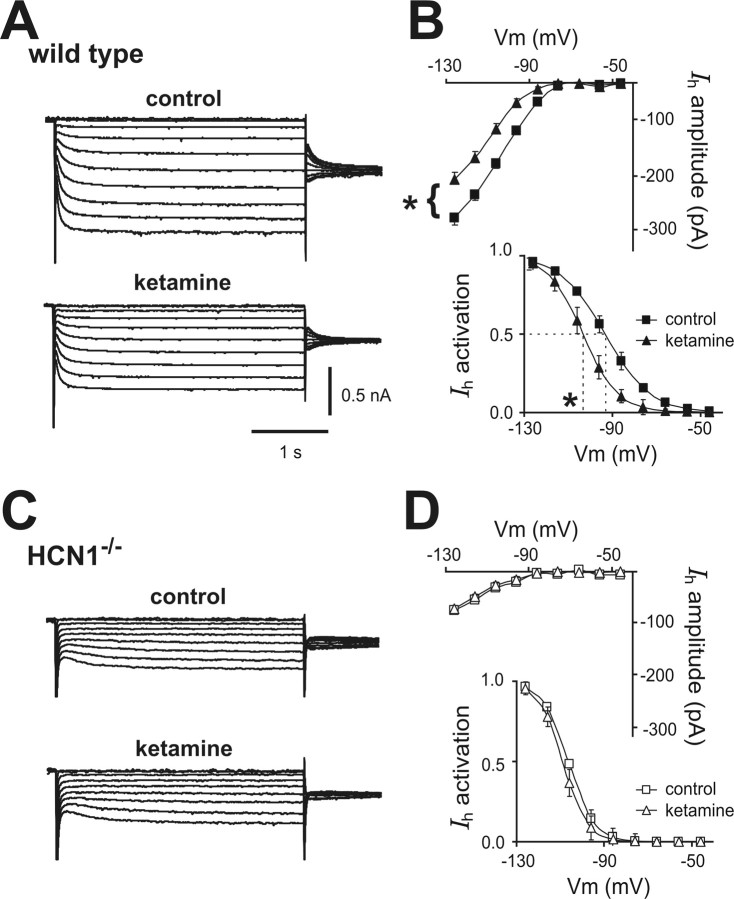
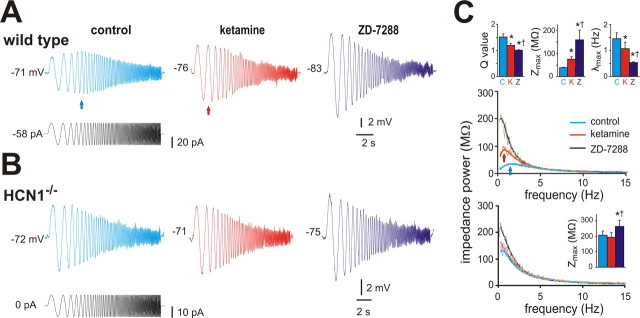
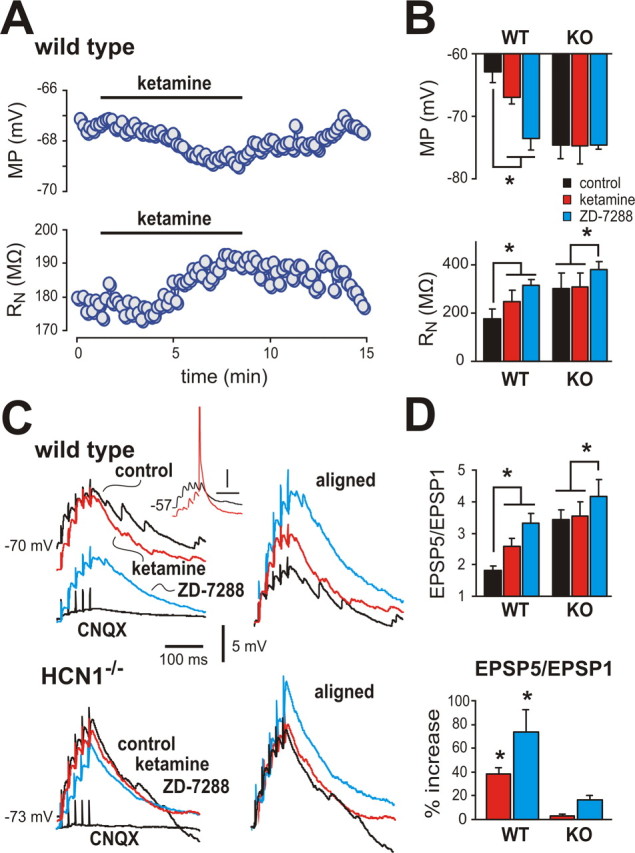
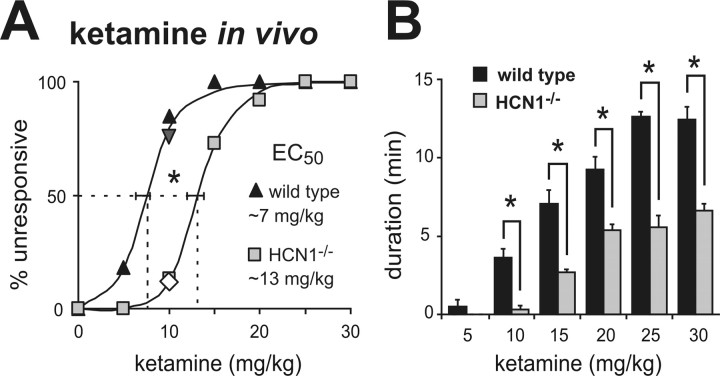
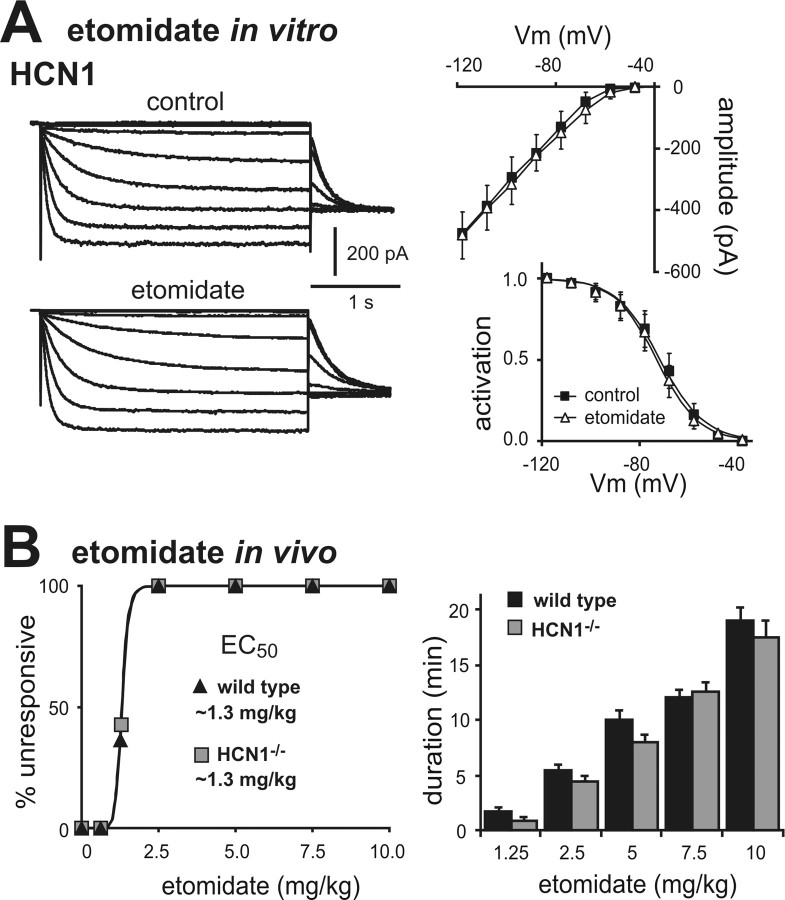
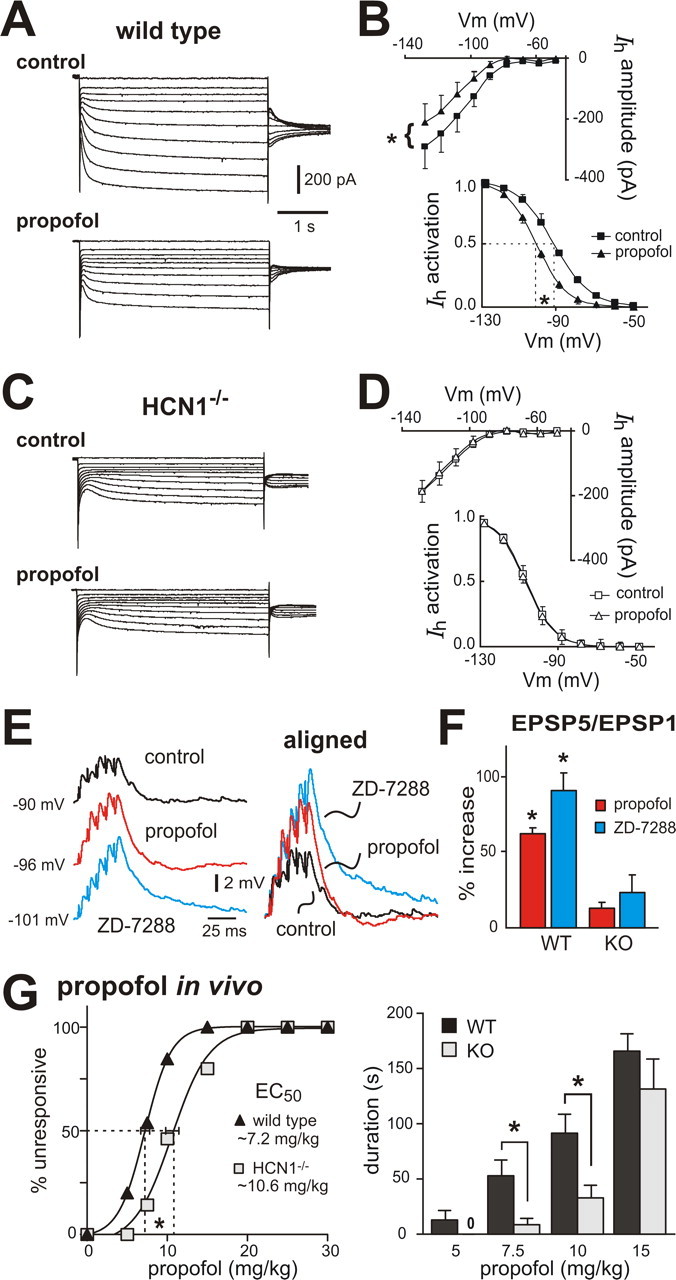
Ketamine has important anesthetic, analgesic, and psychotropic actions. It is widely believed that NMDA receptor inhibition accounts for ketamine actions, but there remains a dearth of behavioral evidence to support this hypothesis. Here, we present an alternative, behaviorally relevant molecular substrate for anesthetic effects of ketamine: the HCN1 pacemaker channels that underlie a neuronal hyperpolarization-activated cationic current (I(h)). Ketamine caused subunit-specific inhibition of recombinant HCN1-containing channels and neuronal I(h) at clinically relevant concentrations; the channels were more potently inhibited by S-(+)-ketamine than racemic ketamine, consistent with anesthetic actions of the compounds. In cortical pyramidal neurons from wild-type, but not HCN1 knock-out mice, ketamine induced membrane hyperpolarization and enhanced dendritosomatic synaptic coupling; both effects are known to promote cortical synchronization and support slow cortical rhythms, like those accompanying anesthetic-induced hypnosis. Accordingly, we found that the potency for ketamine to provoke a loss-of-righting reflex, a behavioral correlate of hypnosis, was strongly reduced in HCN1 knock-out mice. In addition, hypnotic sensitivity to two other intravenous anesthetics in HCN1 knock-out mice matched effects on HCN1 channels; propofol selectively inhibited HCN1 channels and propofol sensitivity was diminished in HCN1 knock-out mice, whereas etomidate had no effect on HCN1 channels and hypnotic sensitivity to etomidate was unaffected by HCN1 gene deletion. These data advance HCN1 channels as a novel molecular target for ketamine, provide a plausible neuronal mechanism for enhanced cortical synchronization during anesthetic-induced hypnosis and suggest that HCN1 channels might contribute to other unexplained actions of ketamine.


Figures

Figure 1.
Figure 1.
Ketamine selectively inhibits currents from HCN1 subunit-containing channels. A, Sample currents from HEK293 cells expressing mHCN1, mHCN2, and mHCN1–mHCN2 channel constructs evoked by hyperpolarizing voltage steps from −38 to −118 mV, before and during exposure to ketamine (20 μm); conditioning voltage steps were followed by a step to −88 mV for tail current analysis. B, Summary data showing averaged (±SEM) shift in half activation potential (V½; top) and current inhibition (percentage from control; bottom) evoked by ketamine for each of the indicated HCN channel constructs. *p < 0.05 by paired t test for ketamine versus control (n = 5, 5, and 8 for mHCN1, mHCN2, and mHCN1–mHCN2). C, Averaged values for shift in V½ (left) and amplitude inhibition (right) of heteromeric mHCN1–mHCN2 currents at different concentrations of racemic ketamine (black squares) or its S-(+)-enantiomer (gray triangles). For the shift in V½, calculated EC50 values were, respectively, 8.2 ± 1.2 μm and 4.1 ± 1.2 μm, with corresponding maximal values of −11.9 ± 0.7 mV and −14.5 ± 0.9 mV; for amplitude inhibition, EC50 values were 15.6 ± 1.2 μm and 7.4 ± 1.3 μm, with corresponding maximal values of 44.5 ± 3.0% and 49.3 ± 3.7% inhibition. The insets show normalized fits to highlight differences in potency between ketamine and S-(+)-ketamine. For both ΔV½ and percentage inhibition, EC50 values were significantly different; also, the maximum shift in V½ was significantly greater for S-(+)-ketamine (p < 0.05 by t test, n ≥ 8 cells at each concentration).
Figure 2.
Figure 2.
Ketamine inhibits I h in cortical pyramidal neurons from wild-type mice, but not from HCN1 knock-out mice. A, C, Voltage-clamp recordings of I h in cortical pyramidal neurons from wild-type and HCN1 knock-out mice, under control conditions (top) and during exposure to ketamine (20 μm, bottom). B, D, Averaged steady-state I–V (top) and voltage dependence of I h activation (bottom) under control conditions (squares) and in the presence of ketamine (20 μm, triangles) in cortical pyramidal neurons from wild-type and HCN1−/− mice. Ketamine induced an approximately −10 mV shift in V½ of I h activation and an approximately 30% decrease in I h amplitude (at −128 mV) in cortical neurons from wild-type mice but had no effect on I h in HCN1 knock-out mice (ΔV½ approximately −2 mV; ∼5% inhibition). *p < 0.05 by paired t test; n = 5 each for wild type and HCN1 knock-outs. Vm, Membrane voltage.
Figure 3.
Figure 3.
Ketamine decreases resonant properties of cortical pyramidal neurons in wild-type but not in HCN1 knock-out mice. A, B, Sample voltage records (top) obtained during injection of a sinusoidal current waveform (bottom) with frequency increasing quadratically from 0.5 to 15 Hz (in 15 s) in cortical pyramidal neurons from wild-type (A) and HCN1 knock-out (B) mice; after control records were obtained, cells were exposed sequentially to ketamine (20 μm) and ZD-7288 (50 μm). In the cell from a wild-type mouse, note that the greatest voltage response is observed at a frequency above 0.5 Hz (blue arrow), but this is shifted toward lower frequencies by ketamine (red arrow) and ZD-7288. C, A Fourier transform was applied to the voltage and current waveforms and the ratio used to obtain impedance power as a function of stimulus frequency; those relationships were fitted with an asymmetric peak function (overlaid lines) for each cell to obtain averaged values (±SEM) for the Q ratio, Zmax and λmax (insets), which represent, respectively, the ratio of peak impedance to that at 0.5 Hz, the peak impedance, and the frequency at peak impedance. As expected for inhibition of I h, ketamine and ZD-7288 increased impedance magnitude (Zmax) and altered resonant properties in cortical pyramidal cells from wild-type mice by shifting the Q value and λmax; in neurons from HCN1 knock-out mice, only Zmax was affected and only by ZD-7288, presumably reflecting effects of the drug on residual HCN2 channels that do not contribute substantially to cell resonant properties. *,† p < 0.05 from control and ketamine conditions, by two-way RM-ANOVA, n = 5 each for wild type and HCN1 knock-outs.
Figure 4.
Figure 4.
Ketamine causes membrane hyperpolarization, increases R N, and enhances EPSP temporal summation in cortical pyramidal neurons from wild-type mice, but not from HCN1 knock-out mice. A, Effect of ketamine (20 μm) on membrane potential (MP, top) and input resistance (R N, bottom) in a cortical pyramidal neuron from a wild-type mouse. B, Averaged data (±SEM) illustrating effects of ketamine and the I h blocker, ZD-7288 (50 μm) on MP (top) and R N (bottom) in cortical pyramidal neurons from wild-type and HCN1 knock-out mice (n = 5 each). C, Sample voltage traces show EPSP recordings (left) obtained from cortical pyramidal neuron from wild-type (top) and HCN1 knock-out (bottom) mice in response to 40 Hz stimulation under control conditions, and during exposure to ketamine and ZD-7288. Right, EPSPs were aligned to initial membrane potential and normalized to the amplitude of the first EPSP in the train to highlight drug effects on temporal summation. Inset, Effects of ketamine from a more depolarized starting potential illustrate increased excitability resulting from enhanced EPSP summation despite ketamine-induced membrane hyperpolarization (spike is truncated; time scale represents 50 ms). D, Averaged EPSP summation ratio (EPSP5/EPSP1) for wild-type mice and HCN1 knock-out mice (n = 6 and 5, respectively) under the indicated conditions (top); averaged percentage increase of EPSP summation induced by ketamine and ZD-7288 (bottom). Ketamine enhanced EPSP summation in cortical neurons from wild-type animals, but not from HCN1 knock-out mice. *p < 0.05 by two-way RM-ANOVA or in D, by paired t test versus control. WT, Wild type; KO, knock-out.
Figure 5.
Figure 5.
HCN1 knock-out mice are less sensitive to hypnotic actions of ketamine. Mice were injected with incrementing concentrations of ketamine (5–30 mg/kg, i.v.) and the percentage of wild-type and HCN1 knock-out animals that failed to right themselves (LORR) was determined as a measure of hypnosis. HCN1 knock-out mice were less sensitive to hypnotic effects of ketamine, as indicated by the increased EC50 for ketamine-induced LORR (A) and the reduced duration of the LORR (B). *p < 0.05 by two-way RM-ANOVA, n = 11 and 13. The inverted triangle and diamond in A represent data from HCN1+/+ (n = 12) and HCN1−/− (n = 8) littermates obtained from heterozygote HCN1+/− mice following a backcross of HCN1 knock-outs to C57BL/6J mice.
Figure 6.
Figure 6.
Etomidate does not inhibit HCN1 channel currents and hypnotic effects of etomidate are unaffected in HCN1 knock-out mice. A, Sample currents from HEK293 cells expressing mHCN1 channels (n = 5) before and during exposure to etomidate (left, 10 μm); averaged steady-state I–V (right, top) and voltage dependence of I h activation (right, bottom) under control conditions (squares) and in the presence of etomidate (triangles). B, Mice were tested for LORR following injection with different concentrations of etomidate (0.625–10 mg/kg, i.v.); hypnotic effects of etomidate were identical in wild-type and HCN1 knock-out animals, determined as either EC50 (left) or duration of LORR (right). NS, by two-way RM-ANOVA, n = 10 and 12. Vm, Membrane voltage.
Figure 7.
Figure 7.
Propofol-induced inhibition of neuronal I h and hypnosis are diminished in HCN1 knock-out mice. A, C, Voltage-clamp recordings of I h in cortical pyramidal neurons from wild-type (A) and HCN1−/− (C) mice under control conditions (top) and during exposure to propofol (5 μm, bottom). B, D, Averaged steady-state I–V (top) and voltage dependence of I h activation (bottom) under control conditions (squares) and in the presence of propofol (triangles) in cortical pyramidal neurons from wild-type (B) and HCN1−/− (D) mice. Propofol induced an approximately −10 mV shift in V½ of I h activation and an approximately 30% decrease in I h amplitude in cortical neurons from wild-type mice (p < 0.01, paired t test, n = 7) but had no effect on I h in HCN1−/− mice (ΔV½ ∼−0.4 mV; ∼0.1% inhibition, n = 6). E, Sample voltage traces show EPSP recordings (left) obtained from cortical pyramidal neuron from wild-type mouse under control conditions, and during exposure to propofol and ZD-7288. EPSPs were aligned to initial membrane potential and normalized to the amplitude of the first EPSP in the train (right) to highlight drug effects on EPSP temporal summation. F, Averaged percentage increase of EPSP summation induced by propofol and ZD-7288 in cortical neurons from wild-type animals and HCN1−/− mice (*p < 0.05 vs control, n = 4 each). G, Mice were tested for LORR after injection with incrementing concentrations of propofol (5–30 mg/kg, i.v.). HCN1 knock-out mice were less sensitive to hypnotic effects of propofol, as indicated by the increased EC50 for propofol-induced LORR (left) and the reduced duration of the LORR (right). *p < 0.05 by two-way RM-ANOVA, n = 10 and 13. Vm, Membrane voltage.

References

    1. Amzica F, Steriade M. Electrophysiological correlates of sleep delta waves. Electroencephalogr Clin Neurophysiol. 1998;107:69–83. - PubMed
    1. Andrásfalvy BK, Makara JK, Johnston D, Magee JC. Altered synaptic and non-synaptic properties of CA1 pyramidal neurons in Kv4.2 knockout mice. J Physiol. 2008;586:3881–3892. - PMC - PubMed
    1. Antkowiak B. In vitro networks: cortical mechanisms of anaesthetic action. Br J Anaesth. 2002;89:102–111. - PubMed
    1. Bazhenov M, Timofeev I, Steriade M, Sejnowski TJ. Computational models of thalamocortical augmenting responses. J Neurosci. 1998;18:6444–6465. - PMC - PubMed
    1. Brewster AL, Chen Y, Bender RA, Yeh A, Shigemoto R, Baram TZ. Quantitative analysis and subcellular distribution of mRNA and protein expression of the hyperpolarization-activated cyclic nucleotide-gated channels throughout development in rat hippocampus. Cereb Cortex. 2007;17:702–712. - PMC - PubMed

Publication types

MeSH terms