. 2009 Jan 21;29(3):620-9.
doi: 10.1523/JNEUROSCI.5486-08.2009.

Long-term homeostasis of extracellular glutamate in the rat cerebral cortex across sleep and waking states

Affiliations

Long-term homeostasis of extracellular glutamate in the rat cerebral cortex across sleep and waking states

Michael B Dash et al. J Neurosci. .

Abstract

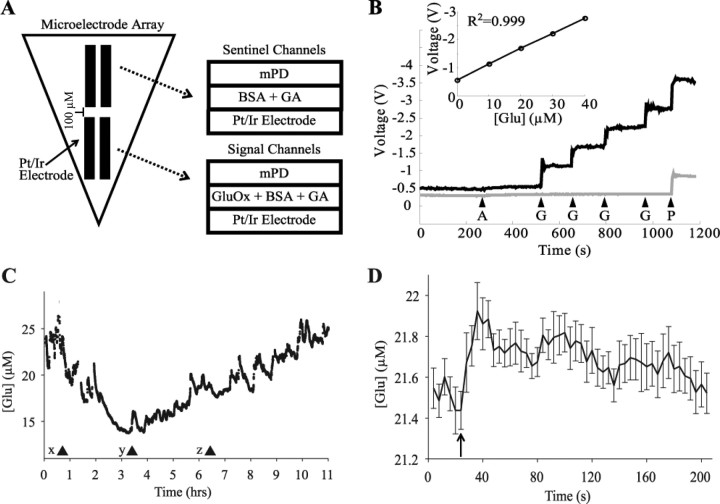
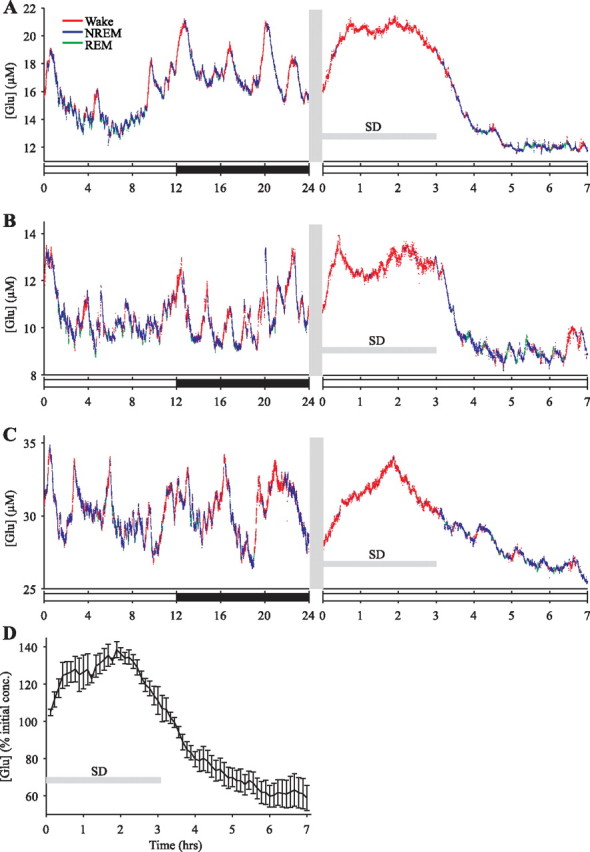
Neuronal firing patterns, neuromodulators, and cerebral metabolism change across sleep-waking states, and the synaptic release of glutamate is critically involved in these processes. Extrasynaptic glutamate can also affect neural function and may be neurotoxic, but whether and how extracellular glutamate is regulated across sleep-waking states is unclear. To assess the effect of behavioral state on extracellular glutamate at high temporal resolution, we recorded glutamate concentration in prefrontal and motor cortex using fixed-potential amperometry in freely behaving rats. Simultaneously, we recorded local field potentials (LFPs) and electroencephalograms (EEGs) from contralateral cortex. We observed dynamic, progressive changes in the concentration of glutamate that switched direction as a function of behavioral state. Specifically, the concentration of glutamate increased progressively during waking (0.329 +/- 0.06%/min) and rapid eye movement (REM) sleep (0.349 +/- 0.13%/min). This increase was opposed by a progressive decrease during non-REM (NREM) sleep (0.338 +/- 0.06%/min). During a 3 h sleep deprivation period, glutamate concentrations initially exhibited the progressive rise observed during spontaneous waking. As sleep pressure increased, glutamate concentrations ceased to increase and began decreasing despite continuous waking. During NREM sleep, the rate of decrease in glutamate was positively correlated with sleep intensity, as indexed by LFP slow-wave activity. The rate of decrease doubled during recovery sleep after sleep deprivation. Thus, the progressive increase in cortical extrasynaptic glutamate during EEG-activated states is counteracted by a decrease during NREM sleep that is modulated by sleep pressure. These results provide evidence for a long-term homeostasis of extracellular glutamate across sleep-waking states.


Figures

Figure 1.
Figure 1.
In vitro calibration and in vivo assessment of microelectrode arrays. A, Schematic of the self-referencing microelectrode arrays. Signal channels are coated with GluOx and are responsive to glutamate, whereas sentinel channels are coated only with the cross-linking proteins BSA and glutaraldehyde (GA). Signal and sentinel channels both have an m-phenylenediamine exclusion layer (mPD). B, Typical in vitro calibration of signal (black line) and sentinel (gray line) channels. Arrows indicate the time of application of ascorbic acid (A; 500 μm), glutamate (G;10 μm), and peroxide (P). Both channels show little or no response to ascorbic acid but respond robustly to peroxide, whereas only the signal channel responds robustly to glutamate. Inset, Calibration curve demonstrating the linear response of the signal channels to changes in glutamate concentration. C, Changes in glutamate concentration after pentobarbital injection in one rat (x; 50 mg/kg, i.p.). The first 90 s episode of arousal with locomotion was observed at (y), but full motor activity was regained only at (z). D, Rapid increase in glutamate concentration during whisker stimulation contralateral to an electrode implanted in the barrel cortex in one rat. The rat received 15 stimulations applied over the course of 90 min. The average of all 15 stimulations, time locked to stimulation onset, is depicted in 4 s intervals. Stimulation onset began at arrow and each stimulation lasted on average 23.72 ± 3.28 s.
Figure 2.
Figure 2.
Changes in glutamate concentration across the light/dark period. A–D, Concentration of extrasynaptic glutamate during sleep and waking across the light/dark period for four individual rats. Each data point represents the average concentration of glutamate across a 4 s window of waking (red) or sleep (blue). Absolute glutamate concentrations are highly variable across the light/dark period but display consistent changes within behavioral states. Cx, Cortex.
Figure 3.
Figure 3.
Dynamic changes in extrasynaptic glutamate concentration during waking, NREM, and REM sleep. A shows a 24 h recording in the prefrontal cortex (Cx) of a single rat. Each data point represents the average concentration of glutamate across a 4 s window of waking (red), NREM (blue), or REM (green). The 2 h window boxed in A is depicted at higher resolution in B, with the inset showing a single NREM-to-REM transition. C and D are organized as A and B, but show 24 h recording in the motor cortex of a different rat.
Figure 4.
Figure 4.
Behavioral-state-dependent changes in glutamate concentration. Histogram of percentage change in glutamate concentration during consolidated periods of waking (all episodes >2.5 min), NREM (>3 min), or REM (>1.5 min) for all rats (n = 8). The observed changes in prefrontal and motor cortex were not significantly different from one another for any behavioral state, and thus data were pooled (n = 8). Values outside of x-axis scale (those with >2%/min) were grouped in the edge bins.
Figure 5.
Figure 5.
The effects of 3 h of sleep deprivation and subsequent recovery sleep on the concentration of glutamate in the prefrontal cortex. A–C depict glutamate concentrations and behavioral state across a 24 h baseline day, 3 h of sleep deprivation, and 4 h of recovery sleep for three individual rats. Each data point represents the average concentration of glutamate across a 4 s epoch of waking (red), NREM (blue), or REM (green). Horizontal gray bars indicate sleep deprivation (SD). The vertical gray line indicates the ∼10 min between the end of the baseline day (time 24; 10 A.M.) and the onset of sleep deprivation (time 0) during which animal care was performed. D, Averaged response to 3 h of sleep deprivation and subsequent 4 h of recovery sleep for all rats (±SEM, n = 5).
Figure 6.
Figure 6.
SWA and decreases in glutamate concentration during NREM sleep across the light period. A, SWA exhibits a typical decline across the light period. B, The rate of glutamate decline during NREM sleep was positively correlated (r = 0.41) with the amount of SWA. Each data point represents the average SWA and change in glutamate concentration during NREM sleep across 2 h blocks during the light period for each rat. One outlier (> 3× SD) was removed, but the correlation remains significant even with its inclusion (p = 0.0496). *p < 0.05.

References

    1. Achermann P, Borbély AA. Mathematical models of sleep regulation. Front Biosci. 2003;8:s683–s693. - PubMed
    1. Alföldi P, Franken P, Tobler I, Borbély AA. Short light-dark cycles influence sleep stages and EEG power spectra in the rat. Behav Brain Res. 1991;43:125–131. - PubMed
    1. Armstrong-James M, Welker E, Callahan CA. The contribution of NMDA and non-NMDA receptors to fast and slow transmission of sensory information in the rat SI barrel cortex. J Neurosci. 1993;13:2149–2160. - PMC - PubMed
    1. Asztely F, Erdemli G, Kullmann DM. Extrasynaptic glutamate spillover in the hippocampus: dependence on temperature and the role of active glutamate uptake. Neuron. 1997;18:281–293. - PubMed
    1. Attwell D, Laughlin SB. An energy budget for signaling in the grey matter of the brain. J Cereb Blood Flow Metab. 2001;21:1133–1145. - PubMed

Publication types