. 2009 Jan 21;29(3):811-27.
doi: 10.1523/JNEUROSCI.2424-08.2009.

Spatiotemporal patterns of cortical activity with bilateral cochlear implants in congenital deafness

Affiliations

Spatiotemporal patterns of cortical activity with bilateral cochlear implants in congenital deafness

Andrej Kral et al. J Neurosci. .

Abstract

Congenital deafness affects developmental processes in the auditory cortex. In this study, local field potentials (LFPs) were mapped at the cortical surface with microelectrodes in response to cochlear implant stimulation. LFPs were compared between hearing controls and congenitally deaf cats (CDCs). Pulsatile electrical stimulation initially evoked cortical activity in the rostral parts of the primary auditory field (A1). This progressed both in the approximate dorsoventral direction (along the isofrequency stripe) and in the rostrocaudal direction. The dorsal branch of the wavefront split into a caudal branch (propagating in A1) and another smaller one propagating rostrally into the AAF (anterior auditory field). After the front reached the caudal border of A1, a "reflection wave" appeared, propagating back rostrally. In total, the waves took approximately 13-15 ms to propagate along A1 and return back. In CDCs, the propagation pattern was significantly disturbed, with a more synchronous activation of distant cortical regions. The maps obtained from contralateral and ipsilateral stimulation overlapped in both groups of animals. Although controls showed differences in the latency-amplitude patterns, cortical waves evoked by contralateral and ipsilateral stimulation were more similar in CDCs. Additionally, in controls, LFPs with contralateral and ipsilateral stimulation were more similar in caudal A1 than in rostral A1. This dichotomy was lost in deaf animals. In conclusion, propagating cortical waves are specific for the contralateral ear, they are affected by auditory deprivation, and the specificity of the cortex for stimulation of the contralateral ear is reduced by deprivation.


Figures
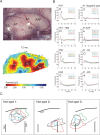
Figure 1.
Figure 1.
Functional organization of the primary auditory cortex of hearing controls with contralateral electrical stimulation (monopolar configuration). A, Image of the exposed cortex of the right hemisphere in one of the HCs with the designation of cortical areas based on anatomical landmarks. AAF, Anterior auditory field; A1, primary auditory field; ED, dorsal part of the posterior ectosylvian gyrus; PAF, posterior auditory field; A2, secondary auditory field; AEF, anterior ectosylvian field; SSS, superior sylvian sulcus; PES, posterior ectosylvian sulcus; AES, anterior ectosylvian sulcus. Below, Color-coded functional map of responses at 12 ms after stimulus with overlaid numbered recording positions. The crosses on the photograph and the activation map are used for alignment purposes. The dashed black line represents the central narrow line. B, Examples of LFPs at different recording positions with the cortical location indicated in the respective title. Similar morphology of LFPs sampled at different times demonstrates the reproducibility of the method. Also, characteristic differences at different positions are discernible. Sample positions in the map (A) are marked by the symbols shown in the corner of each panel. C, The 100 μV contours of the individual hot spots from all four hearing controls (individual animals shown in different color). As reference structures, the AES, PES, and the position and orientation of the central narrow line was used. The blue dashed line represents the overlapping central narrow line after alignment of the maps from each animal.
Figure 2.
Figure 2.
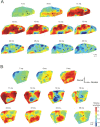
A, B, Example of propagating cortical waves and their variability demonstrated using the normalized amplitudes in two HCs. The general pattern of movement, starting from the initiation spot, continuing through the HS1 and HS2, splitting into two waves (toward AAF and A1) and then propagating in A1 caudally, was similar in all animals. However, the first HC (A) does not show a clear reflection wave, in contrast to the second HC (B), where at 18 ms a wavefront traveling from the caudal part of A1 rostrally appears. The crosses localize the dorsal ends of the posterior and anterior ectosylvian sulcus; the arrows indicate the direction of motion of the propagating wave from the given frame to the following one. The dashed arrows are used to indicate where activity retracts. The hexagon locates the position of the center of gravity. For movies of the propagating waves, see supplemental material (available at www.jneurosci.org).
Figure 3.
Figure 3.
Schematic illustration of propagating waves as observed in hearing controls. The initial wave (white arrows) appeared in the initiating spot, propagating first dorsally and ventrally. Then the wave turned rostrally (to AAF) and caudally (to the caudal end of A1). The more variable reflection wave (gray arrows) started from the border of A1 and ED and traveled rostrally to end up in the center of A1. The size of the arrows corresponds to the spatial extent of the propagating wavefront (the approximate size of the cortical tissue involved in the wave).
Figure 4.
Figure 4.
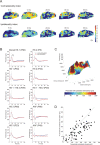
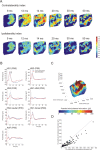
Aural specificity of the cortical responses demonstrated with contralaterality measures. A, Snapshots of changes in contralaterality and ipsilaterality index at the auditory cortex (color scale in the right inset). Poststimulus time is given above each snapshot. At ∼12 ms, high contralateral dominance is found in rostral parts of the cortex, whereas ipsilateral dominance is highest in the caudal parts. Shown is the same animal as in Figure 1. B, LFP morphology at distinct recording positions. Blue, Response to contralateral stimulation; red, response to ipsilateral stimulation. The position is designated in the title of each panel; functional map with the designated positions is shown in Figure 1. At most positions, the peak latency of the response to ipsilateral stimulation (marked by a vertical line) is longer. C, Overlap of the amplitude maps for contralateral stimulation (height profile) and ipsilateral stimulation (color). The largest responses (peaks in the height profile and red colors in the color map) overlay very well within field A1. D, The relationship between the amplitude of ipsilaterally and contralaterally evoked Pa component.
Figure 5.
Figure 5.
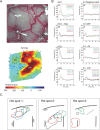
Functional organization of the auditory cortex in a congenitally deaf animal. A, Amplitude map with recording positions and a photograph of the auditory cortex. B, Morphology of the field potentials at different positions of the map. C, Overlap of the 100 μV contours after realignment of the maps as in Figure 1.
Figure 6.
Figure 6.
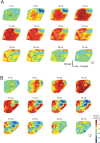
A, B, Example of propagating cortical waves and their variability demonstrated using normalized amplitudes in two congenitally deaf animals. The crosses localize the dorsal ends of the posterior and anterior ectosylvian sulcus; the arrows indicate the direction of motion of the propagating wave from the given frame to the following one. The dashed arrows are used to indicate where activity retracts, and the hexagon locates the position of the center of gravity. For movies of the propagating waves, see supplemental material (available at www.jneurosci.org).
Figure 7.
Figure 7.
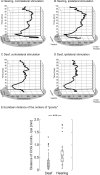
Grand mean trajectories of the center of gravity computed from the normalized activation maps. A, In HCs with contralateral stimulation, the center of gravity moves first rostrally and later caudally, to finally return back rostrally. B, With ipsilateral stimulation, the rostral movement is less well expressed. C, D, In CDCs, the trajectory was shorter (for details, see Results). E, Distances between the center of gravity computed for contralateral and ipsilateral stimulation within 5–20 ms after stimulus. The distance of COG is significantly smaller in CDCs compared with HCs, demonstrating that activation maps with contralateral and ipsilateral stimulation are more similar in the former group.
Figure 8.
Figure 8.
Aural specificity of cortical responses in a deaf animal (the same animal as in Figure 5). A, Snapshots of contralaterality measures at different poststimulus times. A remarkable similarity of the contralaterality and ipsilaterality shows up, demonstrating that cortical topology has changed in deafness (compare with the hearing controls in Fig. 4). B, Morphology of LFPs with contralateral stimulation (blue) and ipsilateral stimulation (red) at different recording positions. Note the similarity in the morphology and peak latency of the LFPs at most positions. For a map of recording positions, see Figure 5. C, Overlay of the amplitude profile obtained with contralateral stimulation (height–profile) and ipsilateral stimulation (color). In deaf animals also, the hot spots with contralateral and ipsilateral stimulation can be seen to overlay well (compare Fig. 4). D, The relationship between the amplitudes of ipsilaterally and contralaterally evoked Pa components.
Figure 9.
Figure 9.
Amplitude–latency relationships of component Pa with stimulation at the contralateral and the ipsilateral ear. A, Controls demonstrate a complex relationship between latencies and amplitudes, with a prominent difference in latency distribution with contralateral and ipsilateral stimulation. On average, contralateral responses have shorter latencies. B, In congenitally deaf animals, these differences are less pronounced; amplitude–latency relationships for contralateral and ipsilateral stimulation are similar. Also, the range of latencies is smaller. C, Statistical comparison of peak latencies in hearing and deaf animals. Controls demonstrate shorter peak latencies with contralateral stimulation. In deaf animals, latencies are not different. ***p < 0.001.
Figure 10.
Figure 10.
Comparison of laterality measures in the remaining three hearing and deaf animals. Shown are snapshots at latencies when high indices were distributed over the largest cortical region. A, A dichotomy of contralaterality and ipsilaterality index with respect to cortical position is clearly discernible in hearing controls: In the rostral part of A1, high contralaterality is found, documenting a large difference in amplitude between ipsilaterally evoked and contralaterally evoked LFPs. In the caudal part of the investigated cortical region, similar LFP amplitudes for ipsilateral and contralateral stimulation (i.e., the largest ipsilaterality indices) were found. B, In deaf animals, this dichotomy disappeared.
Figure 11.
Figure 11.
The profile of the dissimilarity index in controls (black bars). A smaller dissimilarity index was found in HS3 than in HS1. This difference disappeared in deaf cats (gray bars). Error bars indicate SD. **p < 0.01; ***p < 0.001.

References

    1. Arieli A, Sterkin A, Grinvald A, Aertsen A. Dynamics of ongoing activity: explanation of the large variability in evoked cortical responses. Science. 1996;273:1868–1871. - PubMed
    1. Behrendt M. Entwicklung und Herstellung eines Cochlea-Implantates zur chronischen Stimulation von gehörlosen weißen Katzen. Frankfurt am Main, Germany: J. W. Goethe University; 1999.
    1. Benucci A, Frazor RA, Carandini M. Standing waves and traveling waves distinguish two circuits in visual cortex. Neuron. 2007;55:103–117. - PMC - PubMed
    1. Bierer JA, Middlebrooks JC. Auditory cortical images of cochlear-implant stimuli: dependence on electrode configuration. J Neurophysiol. 2002;87:478–492. - PubMed
    1. Bozhko GT, Slepchenko AF. Functional organization of the callosal connections of the cat auditory cortex. Neurosci Behav Physiol. 1988;18:323–330. - PubMed

Publication types