. 2009 Feb;20(2):278-88.
doi: 10.1681/ASN.2008060564. Epub 2009 Jan 21.

Characterization of PKD protein-positive exosome-like vesicles

Affiliations

Characterization of PKD protein-positive exosome-like vesicles

Marie C Hogan et al. J Am Soc Nephrol. 2009 Feb.

Abstract

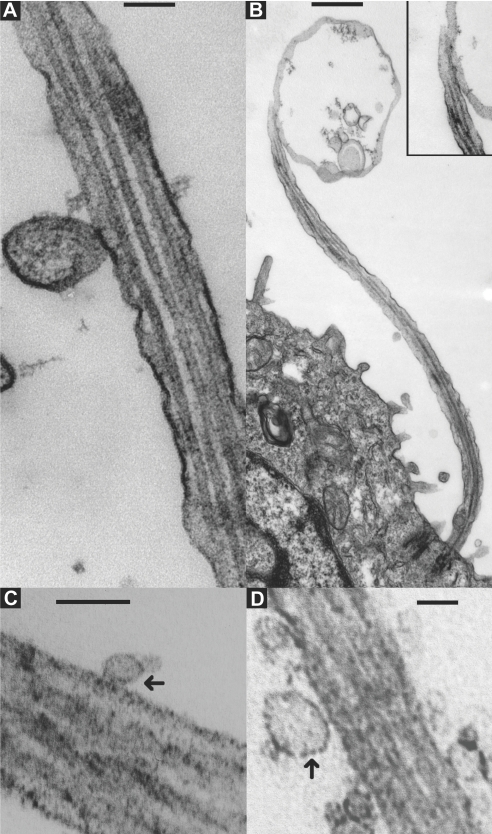
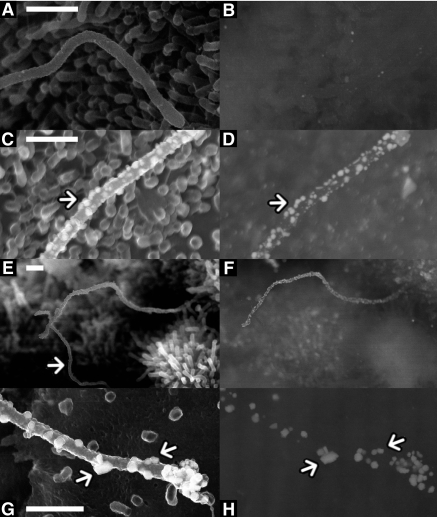
Proteins associated with autosomal dominant and autosomal recessive polycystic kidney disease (polycystin-1, polycystin-2, and fibrocystin) localize to various subcellular compartments, but their functional site is thought to be on primary cilia. PC1+ vesicles surround cilia in Pkhd1(del2/del2) mice, which led us to analyze these structures in detail. We subfractionated urinary exosome-like vesicles (ELVs) and isolated a subpopulation abundant in polycystin-1, fibrocystin (in their cleaved forms), and polycystin-2. This removed Tamm-Horsfall protein, the major contaminant, and subfractionated ELVs into at least three different populations, demarcated by the presence of aquaporin-2, polycystin-1, and podocin. Proteomic analysis of PKD ELVs identified 552 proteins (232 not yet in urinary proteomic databases), many of which have been implicated in signaling, including the molecule Smoothened. We also detected two other protein products of genes involved in cystic disease: Cystin, the product of the mouse cpk locus, and ADP-ribosylation factor-like 6, the product of the human Bardet-Biedl syndrome gene (BBS3). Our proteomic analysis confirmed that cleavage of polycystin-1 and fibrocystin occurs in vivo, in manners consistent with cleavage at the GPS site in polycystin-1 and the proprotein convertase site in fibrocystin. In vitro, these PKD ELVs preferentially interacted with primary cilia of kidney and biliary epithelial cells in a rapid and highly specific manner. These data suggest that PKD proteins are shed in membrane particles in the urine, and these particles interact with primary cilia.


Figures

Figure 1.
Figure 1.
Western analysis shows urinary ELVs are enriched for PC1, PC2, and FCP. (A) Comparison of ELV (Ex) (lane 1) and exogenously expressed PC1 (rPC1; 5 μg membrane protein (lane 2) and after PNGase treatment (lanes 3 and 4), detected with PC1 mAb (7e12). ELV PC1 seems to be heavily glycosylated and similar in size to unGPS cleaved PC1 (550 kD), but after deglycosylation is similar in size (340 kD) to the GPS cleaved rPC1. (B) Detection of PC2 in ELVs (Ex; lane 5) and rPC2 (lane 6) with the PC2 antisera YCC2 shows a 130-kD product in both—a probable dimer is also seen with exogenously expressed PC2 (lane 6). (C) A similar sized product (550 kD) is detected in ELVs (lane 7) and rFCP (lane 8) with the FCP mAb11.
Figure 2.
Figure 2.
Purification of human urinary ELVs on a 5 to 30% sucrose gradient in D2O. (A) Refractive index profile (in red) ranging linearly from η = 1.33 to 1.37 and protein concentration of the fractions (in blue) in μg/ml. Most of the protein is in the first three and last two fractions. (B) Distribution of PC1, PC2, FCP, and CD133, which co-band in fractions 7, 8, and 9. THP is present in the pellet and the last three fractions. (C) SEM of PKD-ELVs bound to poly-l-lysine coverslips from fraction 9 (bar = 1 μm) and (D) ELVs and fibrils of THP from fraction 12 (same scale as in C). (E through I) ImmunoEM shows that PC1, PC2, FCP, and CD133 are co-localized on ELVs. (E) Control (no primary antibody) on negatively stained ELVs. (F) PC2 (10 nm gold) and CD133 (5 nm gold), (G) PC2 (10 nm gold) and PC1 (5 nm gold), (H) PC2 (10 nm gold) and FCP (5 nm gold), and (I) a large multilaminate ELV, PC2 (10 nm gold), and FCP (5 nm gold) suggesting a MVB origin for PKD-ELVs.
Figure 3.
Figure 3.
Coomassie stained 4 to 12% SDS-PAGE gels of urinary ELVs. (A) A total of 30 μg of crude ELVs prepared by ultracentrifuging urine at 150,000 × g for 1 h. Note the large amount of THP centered at approximately 85 kD. (B) A total of 30 μg of pure PKD-ELVs; note the lack of a prominent THP band. (C) A total of 30 μg of pure PKD-ELVs that have been deglycosylated with PNGase F; note the prominent PNGase F band at 36 kD. The 35 gel slices selected for the proteomic analysis are shown.
Figure 4.
Figure 4.
Cleavage of PC1 and FCP and comparison of PKD-ELV proteome with other urinary proteomes. (A) The PC1 protein with the GPS cleavage site at aa 3048..3049. Peptides found in gel slice 4 (approximately 500 to 550 kD) are represented by black bars; peptides found in gel slices 8 and 10 (approximately 150 kD) are represented by red bars (Supplemental Figure 2). (B) The FCP protein with the proprotein convertase consensus at 3615..3620. Peptides found in gel slices 3 to 4 (approximately 550 kD) are represented by black bars, whereas the two peptides seen in gel slice 18 (approximately 55 to 60 kD) are represented by red bars (Supplemental Figure 3). No other gel slices yielded peptides from PC1 and FCP in the glycosylated run. (C) Comparison Venn diagram of peptides found in a total urine proteome (Adachi), crude urinary ELVs (Pisitkun), with PKD-ELVs (our data, Hogan). Numbers represent the number of shared proteins in the respective overlapping circles. The individual sets of proteins are available in Supplemental Database 2.
Figure 5.
Figure 5.
In vivo analysis of ELV–ciliary interactions in human ARPKD and the Pkhd1del2/del2 mouse. (A and B) Transmission electron microscopy of primary cilia from the collecting duct of a neonate with mutation-proven ARPKD. (A) 120 nm diameter ELV adhering to the shaft of a primary cilium (bar = 100 nm). (B) A large MVB (1 to 2 μm) interacting with a primary cilium (bar = 500 nm). (Insert) Enlarged view of the adhesion site. Note the presence of two membranes at the site of attachment in both A and B. (C) ELVs interacting with a WT mouse biliary primary cilium (bar = 100 nm). (D) Accumulating ELVs on a biliary cholangiocyte primary cilium of a Pkhd1del2/del2 mouse (bar = 100 nm). Note (arrows) the interaction seems to be an adhesive rather than a budding event.
Figure 6.
Figure 6.
Location of PKD ELVs in wild-type rat biliary epithelium and Pkhd1del2/del2 mouse biliary epithelium: (A and B) PC1 staining in Pkhd1del2/del2 mouse biliary cilia using the PC1 monoclonal antibody 7e12 and nanogold with gold-on-gold enhancement. (A) An ELV adherent to the shaft of Pkhd1del2/del2 mouse biliary primary cilium; no primary antibody, control (bar = 100 nm). (B) A cluster of PKD-ELVs interacting with a Pkhd1del2/del2 mouse biliary primary cilium (black arrows) (bar = 100 nm). This shows that the vesicles/exosomes adherent to the primary cilium in the Pkhd1del2/del2 mouse are PC1 positive. (C through G). TEM showing rat biliary epithelium stained with anti-PC1 as above; (C) wild-type rat biliary primary cilium stained with 7e12 showing apical membrane microvilli and a primary cilium shaft. Both are negative for PC1; however, the primary cilium is associated with nearby PC1 positive cup shaped ELVs (PKD-ELVs) (black asterisk) (scale bar = 500 nm). (D) An enlarged view of these (×2). (E) A PKD-ELV (white asterisk in C) extruding from an intracellular vesicle (perhaps an MVB) close to the base of the primary cilium (×3). (F and G) MVB origin of PC1+ ELVs. (F) Normal rat biliary epithelia showing an unstained MVB, no primary antibody (bar = 100 nm); (G) MVB showing ILVs (white arrows) positive for PC1 (bar = 100 nm). The bulk of PC1 staining is therefore restricted to the MVB and PKD-ELV.
Figure 7.
Figure 7.
Biotinylated PKD-ELVs interact with primary cilia in IMCD3 cells. Biotinylated PKD-ELVs were applied to polarized IMCD3 cells for 1, 2, 5, and 10 min, then washed three times in Hanks’ and fixed in 2.5% glutaraldehyde PBS. The ELVs were detected with 1.4 nm of Nanogold, enhanced using the autometallographic deposition of gold on gold, and then coated with carbon to a thickness of 15 nm. (Left) Standard SEMs of the IMCD (using secondary electrons). (Right) Images generated by backscattered electrons showing the distribution of gold and therefore exosomal protein. Control IMCDs were not treated with ELVs. Bar = 500 nm. Magnification, ×15,000.
Figure 8.
Figure 8.
ELVs fuse with a subpopulation of primary cilia in BUs (primary biliary epithelial cells) and IMCD3 cells. (A, C, E, and G) secondary electrons; (B, D, F, and H) backscattered electrons. (A and B) Magnified view of a non–ELV-treated primary cilium. (C and D) Magnified view of a primary cilium treated with ELVs for 1 min. Note the raised areas on the cilium, suggesting that the ELVs are interacting with the cilium (examples arrowed). (E and F) Magnified primary cilia at 2 min, note that one cilium (arrowed) has no gold associated with it. (G and H) Magnified, SEM of an IMCD3 primary cilium treated with PKD-ELVs for 1 min. Note the raised blebs on the tip and shaft of this primary cilium (examples arrowed). Bars = 500 nm. Magnifications: ×60,000 in A through D; ×15,000 in E and F; ×80,000 in G and H.

References

    1. Torres V, Holley K, Offord K. Epidemiology. In: Problems in Diagnosis and Management of Polycystic Kidney Disease, edited by Grantham JJ, Kansas City: PKR Foundation Kansas City, 1985, pp 349–369
    1. Wilson PD: Polycystic kidney disease. N Engl J Med 350: 151–164, 2004 - PubMed
    1. The polycystic kidney disease 1 gene encodes a 14 kb transcript and lies within a duplicated region on chromosome 16. The European Polycystic Kidney Disease Consortium. Cell 77: 881–894, 1994 - PubMed
    1. Polycystic kidney disease: The complete structure of the PKD1 gene and its protein. The International Polycystic Kidney Disease Consortium. Cell 81: 289–298, 1995 - PubMed
    1. Hughes J, Ward CJ, Peral B, Aspinwall R, Clark K, Millan JL, Gamble V, Harris PC: The polycystic kidney disease 1 (PKD1) gene encodes a novel protein with multiple cell recognition domains. Nat Genet 10: 151–160, 1995 - PubMed

Publication types