

Interstrain variation in cardiac and respiratory adaptation to repeated ozone and particulate matter exposures
- PMID: 19158411
- PMCID: PMC2698605
- DOI: 10.1152/ajpregu.90808.2008
Interstrain variation in cardiac and respiratory adaptation to repeated ozone and particulate matter exposures
Abstract
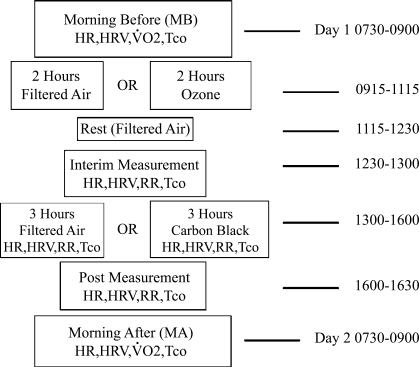
Increased ambient particulate matter (PM) is associated with adverse cardiovascular and respiratory outcomes, as demonstrated by epidemiology studies. Several studies have investigated the role of copollutants, such as ozone (O(3)), in this association. It is accepted that physiological adaptation involving the respiratory system occurs with repeated exposures to O(3). We hypothesize that adaptation to PM and O(3) varies among different inbred mouse strains, and cardiopulmonary adaptation to O(3) is a synchronized response between the cardiac and respiratory systems. Heart rate (HR), HR variability (HRV), and the magnitude and pattern of breathing were simultaneously measured by implanted telemeters and by plethysmography in three inbred mouse strains: C57Bl/6J (B6), C3H/HeJ (HeJ), and C3H/HeOuJ (OuJ). Physiological responses were assessed during dual exposures to filtered air (FA), O(3) (576 +/- 32 parts/billion), and/or carbon black (CB; 556 +/- 34 mug/m(3)). Exposures were repeated for 3 consecutive days. While each strain showed significant reductions in HR during CB with O(3) preexposure (O(3)CB) on day 1, prominent HRV responses were observed in only HeJ and OuJ mice. Each strain also differed in their adaptation profile in response to repeated O(3)CB exposures. Whereas B6 mice showed rapid adaptation in HR after day 1, HeJ mice generally showed more moderate HR and HRV adaptation after day 2 of exposure. Unlike either B6 or HeJ strains, OuJ mice showed little evidence of HR or HRV adaptation to repeated O(3)CB exposure. Adaptation profiles between HR regulation and breathing characteristics were strongly correlated, but these associations also varied significantly among strains. These findings suggest that genetic factors determine the responsivity and adaptation of the cardiac and respiratory systems to repeated copollutant exposures. During O(3)CB exposure, adaptation of cardiac and respiratory systems is markedly synchronized, which may explain a potential mechanism for adverse effects of PM on heart function.
Figures


Similar articles
-
Adverse cardiovascular effects with acute particulate matter and ozone exposures: interstrain variation in mice.Environ Health Perspect. 2008 Aug;116(8):1033-9. doi: 10.1289/ehp.10689. Environ Health Perspect. 2008. PMID: 18709144 Free PMC article.
-
Age-related changes in cardiac and respiratory adaptation to acute ozone and carbon black exposures: interstrain variation in mice.Inhal Toxicol. 2010 Dec;22 Suppl 2:84-94. doi: 10.3109/08958378.2010.503974. Epub 2010 Sep 30. Inhal Toxicol. 2010. PMID: 20883109
-
Variation in echocardiographic and cardiac hemodynamic effects of PM and ozone inhalation exposure in strains related to Nppa and Npr1 gene knock-out mice.Inhal Toxicol. 2010 Jul;22(8):695-707. doi: 10.3109/08958378.2010.487549. Inhal Toxicol. 2010. PMID: 20540624
-
Variation in heart rate regulation and the effects of particle exposure in inbred mice.Inhal Toxicol. 2007 Jun;19(8):621-9. doi: 10.1080/08958370701353049. Inhal Toxicol. 2007. PMID: 17510835
-
Mechanisms of morbidity and mortality from exposure to ambient air particles.Res Rep Health Eff Inst. 2000 Feb;(91):5-88; discussion 89-103. Res Rep Health Eff Inst. 2000. PMID: 10817681 Review.
Cited by
-
Inhaled ozone (O3)-induces changes in serum metabolomic and liver transcriptomic profiles in rats.Toxicol Appl Pharmacol. 2015 Jul 15;286(2):65-79. doi: 10.1016/j.taap.2015.03.025. Epub 2015 Mar 31. Toxicol Appl Pharmacol. 2015. PMID: 25838073 Free PMC article.
-
Assessment of routine procedure effect on breathing parameters in mice by using whole-body plethysmography.J Am Assoc Lab Anim Sci. 2012 Jul;51(4):469-74. J Am Assoc Lab Anim Sci. 2012. PMID: 23043813 Free PMC article.
-
Mitochondrial - nuclear genetic interaction modulates whole body metabolism, adiposity and gene expression in vivo.EBioMedicine. 2018 Oct;36:316-328. doi: 10.1016/j.ebiom.2018.08.036. Epub 2018 Sep 16. EBioMedicine. 2018. PMID: 30232024 Free PMC article.
-
Cardiovascular depression in rats exposed to inhaled particulate matter and ozone: effects of diet-induced metabolic syndrome.Environ Health Perspect. 2014 Jan;122(1):27-33. doi: 10.1289/ehp.1307085. Epub 2013 Oct 29. Environ Health Perspect. 2014. PMID: 24169565 Free PMC article.
-
The contribution of the neuroendocrine system to adaption after repeated daily ozone exposure in rats.Toxicol Appl Pharmacol. 2022 Jul 15;447:116085. doi: 10.1016/j.taap.2022.116085. Epub 2022 May 23. Toxicol Appl Pharmacol. 2022. PMID: 35618032 Free PMC article.
References
-
- Arito H, Takahashi M, Iwasaki T, Uchiyama I. Age-related changes in ventilatory and heart rate responses to acute ozone exposure in the conscious rat. Ind Health 35: 78–86, 1997. - PubMed
-
- Balmes JR, Chen LL, Scannell C, Tager I, Christian D, Hearne PQ, Kelly T, Aris RM. Ozone-induced decrements in FEV1 and FVC do not correlate with measures of inflammation. Am J Respir Crit Care Med 153: 904–909, 1996. - PubMed
-
- Bergamaschi E, De Palma G, Mozzoni P, Vanni S, Vettori MV, Broeckaert F, Bernard A, Mutti A. Polymorphism of quinone-metabolizing enzymes and susceptibility to ozone-induced acute effects. Am J Respir Crit Care Med 163: 1426–1431, 2001. - PubMed
Publication types
MeSH terms
Substances
Grants and funding
LinkOut - more resources
Full Text Sources
Medical