. 2009 Jan 22;457(7228):475-9.
doi: 10.1038/nature07664.

Anticipatory haemodynamic signals in sensory cortex not predicted by local neuronal activity

Affiliations

Anticipatory haemodynamic signals in sensory cortex not predicted by local neuronal activity

Yevgeniy B Sirotin et al. Nature. .

Abstract

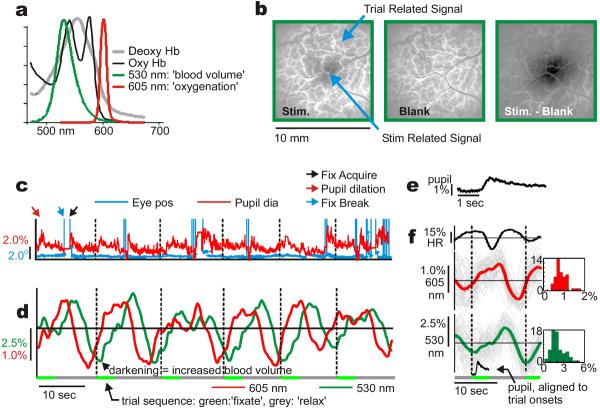
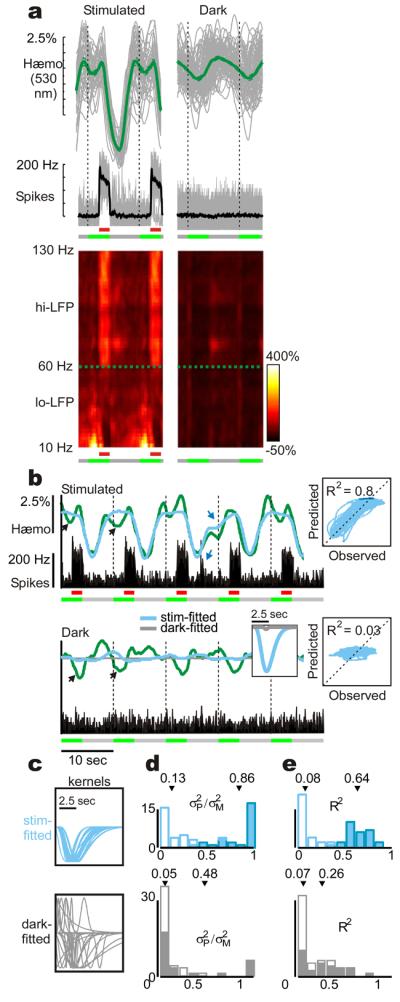
Haemodynamic signals underlying functional brain imaging (for example, functional magnetic resonance imaging (fMRI)) are assumed to reflect metabolic demand generated by local neuronal activity, with equal increases in haemodynamic signal implying equal increases in the underlying neuronal activity. Few studies have compared neuronal and haemodynamic signals in alert animals to test for this assumed correspondence. Here we present evidence that brings this assumption into question. Using a dual-wavelength optical imaging technique that independently measures cerebral blood volume and oxygenation, continuously, in alert behaving monkeys, we find two distinct components to the haemodynamic signal in the alert animals' primary visual cortex (V1). One component is reliably predictable from neuronal responses generated by visual input. The other component-of almost comparable strength-is a hitherto unknown signal that entrains to task structure independently of visual input or of standard neural predictors of haemodynamics. This latter component shows predictive timing, with increases of cerebral blood volume in anticipation of trial onsets even in darkness. This trial-locked haemodynamic signal could be due to an accompanying V1 arterial pumping mechanism, closely matched in time, with peaks of arterial dilation entrained to predicted trial onsets. These findings (tested in two animals) challenge the current understanding of the link between brain haemodynamics and local neuronal activity. They also suggest the existence of a novel preparatory mechanism in the brain that brings additional arterial blood to cortex in anticipation of expected tasks.


Figures

Fig 1
Fig 1. Periodic fixation tasks evoke stimulus-independent, trial-linked signals even in the dark
a: Normalized emission spectra of the 2 illumination sources (LEDs), superimposed on in vitro absorbance spectra for deoxy- and oxyhæmoglobin (units: 104 cm−1/M). b: ‘Stim’: V1 ‘blood volume’ response to small, brief visual stimulus presented during periodic fixation trials. ‘Blank’: Signal in trial with no visual stimulus. ‘Stim-Blank’: stimulus-specific response. c: Eye position and pupil diameter (% of mean), consecutive trials. (Vertical dashed lines: trial onsets. Note pupil dilation, fix break, fix acquire, shown for first trial). Scales colour-coded. d: Cortical signals, colour-coded by imaging wavelength. e, f: Trial-triggered averages. (grey lines: individual trials; thick lines: mean, +/− SEM, n=51: 605 nm: mean peak-to-peak amplitude: 1.19% +/− 0.08; 530 nm: 3.47% +/− 0.21). Population histograms: 605 nm: mean=0.86%, std=0.29, N=47 experiments. 530 nm: mean=2.17%, std=0.97, N=66.
Fig 2
Fig 2. Local neuronal activity predicts visually driven, but not trial-related hæmodynamics
a: Trial-triggered mean hæmodynamic (‘blood volume’) and electrophysiological signals comparing stimulus-driven and dark-room responses, representative experiment. LFP power spectrum (bottom) normalized to pre-stimulus dark power (2-Hz resolution). b: Comparing measured hæmodynamics (green) with optimal predictions from concurrent spiking, same experiment. Blue, gray –using kernels (inset) obtained by fitting stimulated or dark-room signals respectively; (same colour code used all through. Dark-room kernel and prediction almost indistinguishable from a flat line; prediction shown for dark only, to avoid clutter.). Black arrows: trial-related activity not predicted in either the stimulated or dark-room trials. Blue arrows: random bursts of neuronal activity generate matching deflections in the predicted and observed trace. Right: scatter-plots and R2 values of observed vs. predicted hæmodynamics using stimulus-based predictors. c: Optimal kernels across days (amplitude normalized for comparison; N = 28 recording sites). d-e: Descriptive statistics of spike-based fits. top – stimulus-based prediction; bottom – dark-room based. d: ratio of variance between predicted and measured signals (σP2M2). e: R2 statistic: Open vs. closed bars represent dark-room vs. stimulus driven sessions, respectively. Arrows mark population means.
Fig 3
Fig 3. Trial-related hæmodynamic signals entrain to anticipated trial onsets, stretching to conform to the trial period
a: Schematic: dark-room fixation trials, each with the same 4-sec ‘fixate’ epochs but in blocks of different trial periods, short (8-sec, blue) and long (20-sec; pink; same colour scheme in other panels & Fig 4). b, c: ‘Blood volume’ signal, short and long trials respectively. Averages triggered on trial onsets, +/− SEM (b: n=220 trials; c: N=179). Arrowheads: peak brightening (red), darkening (black). Dotted white line in panel c shows where short trial onset would have occurred. d: population histograms of peak brightening and darkening in units of trial phase (0=trial start, 1=trial end, start of next trial; brightening: mean=0.43, sd=0.16; darkening, mean=0.89, sd=0.21; N=66; Trial periods ranging from 6 to 30 sec). e, f: Signal at transitions between trial periods: short-to-long (e; N=16 trials, mean+/− SEM), and long-to-short (f: N=10); arrowheads are aligned, in each case, to the panel above for comparison of signal features. Dotted white line as in c. g: Left: Short-to-Long transition trial (green) is statistically indistinguishable from other short trials over one short-trial period (blue background). (Bootstrap analysis. Green: mean transition trial; grey: means of 500 random N=16-trial subsets of the short trials to match statistics of transition trial; black: grand mean of all short trials, same as b; inset histogram: correlation of random subsets with grand mean; arrowhead: correlation of transition trial with grand mean = 0.97). Right: Short-to-Long transition response is distinct from random N=16-trial subsets of long trials. Same conventions as on the left, with the correlation coefficients being calculated, again, over the duration of one short period (pink background).
Fig 4
Fig 4. Mean ‘blood volume’ signal is closely matched, temporally, by V1 arterial contraction-dilation cycle
a: Mean trial-triggered signals and b: individual frames showing fractional signal change relative to trial-mean image. Inset square: green: ‘fixate’, black: ‘relax’. Magnified sections show arterial contraction (white walls), dilation (black walls). Grey trace in panel a: arterial signal relative to ‘parenchyma baseline,’ (Fig S11 – method for calculating arterial signal. Arterial trace shifted vertically from overall mean for visibility). c: Timing of peak arterial contraction (dilation), as phase within trial, matches peak brightening (darkening) of mean signal: red square (black diamond) respectively. d - g: Arterial signal (grey) closely matches mean signal (green) for different trial periods (d, e) and at transitions between periods (f, g); same experiment, conventions as in Fig 3b, c, f, g (traces shifted vertically for visibility). Note close matches between corresponding peaks and troughs (arrows), indicated as in Fig 3.

Comment in

References

    1. Logothetis NK, Wandell BA. Interpreting the BOLD signal. Annu. Rev. Physiol. 2004;66:735–769. - PubMed
    1. Logothetis NK, Pauls J, Augath M, Trinath T, Oeltermann A. Neurophysiological investigation of the basis of the fMRI signal. Nature. 2001;412:150–157. - PubMed
    1. Vanzetta I, Grinvald A. Increased cortical oxidative metabolism due to sensory stimulation: implications for functional brain imaging. Science. 1999;286:1555–1558. - PubMed
    1. Ugurbil K, Toth LJ, Kim D-S. How accurate is magnetic resonance imaging of brain function. Trends Neurosi. 2003;26(2):108–114. - PubMed
    1. Shulman RG, Rothman DL, Behar KL, Hyder F. Energetic basis for brain activity: implications for neuroimaging. Trends Neurosi. 2004;27(8):489–495. - PubMed

Publication types

MeSH terms