. 2009 Jan;116(1):84-115.
doi: 10.1037/a0014351.

Signal detection with criterion noise: applications to recognition memory

Affiliations

Signal detection with criterion noise: applications to recognition memory

Aaron S Benjamin et al. Psychol Rev. 2009 Jan.

Abstract

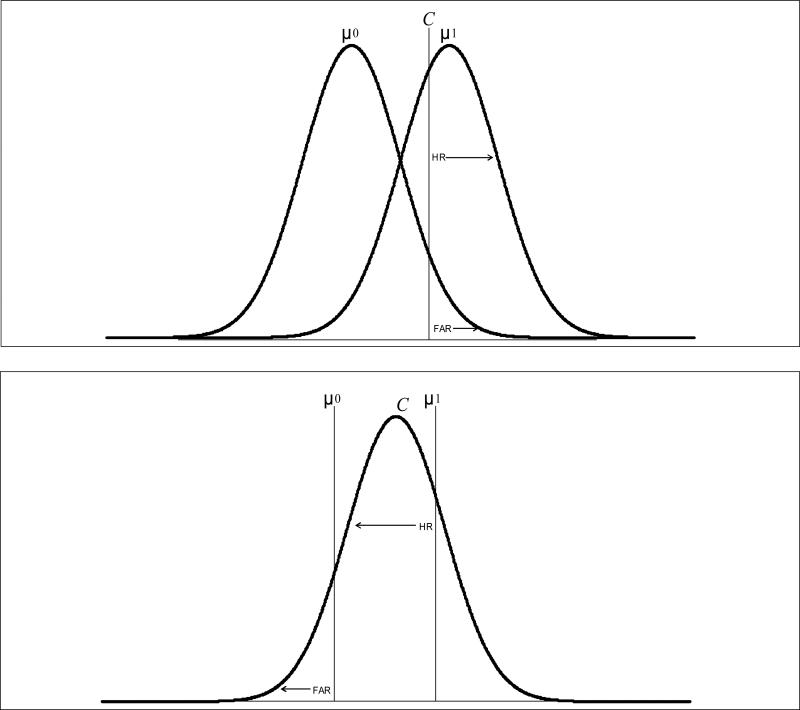
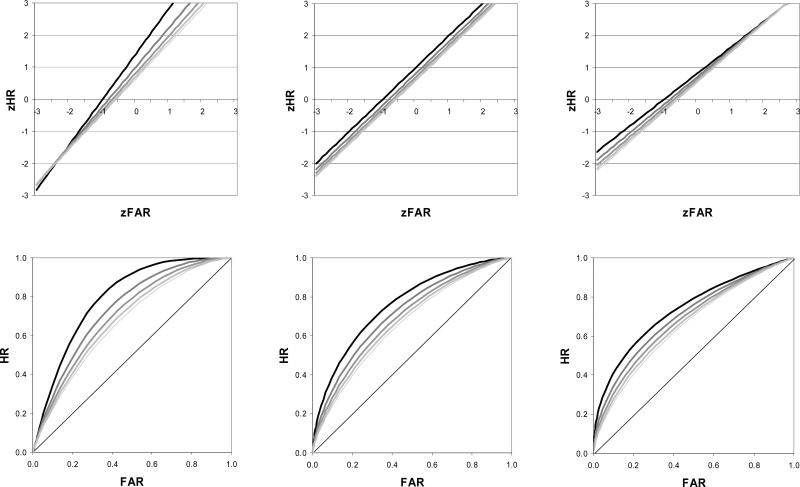
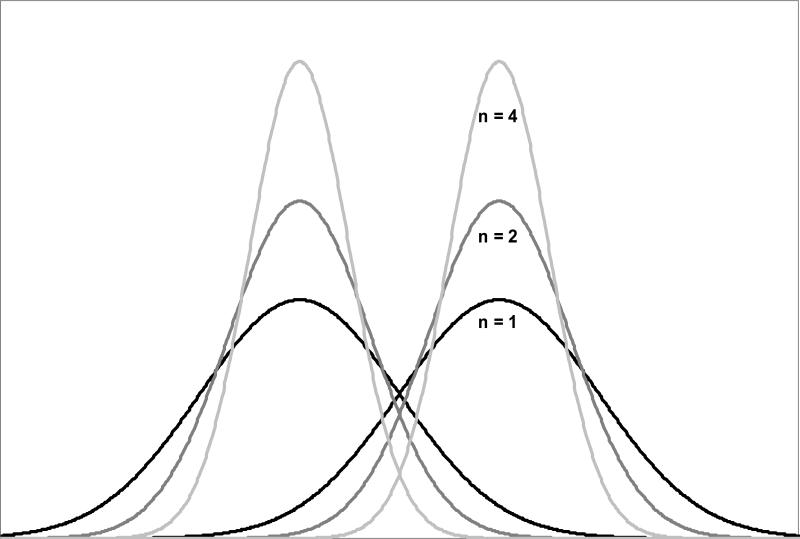
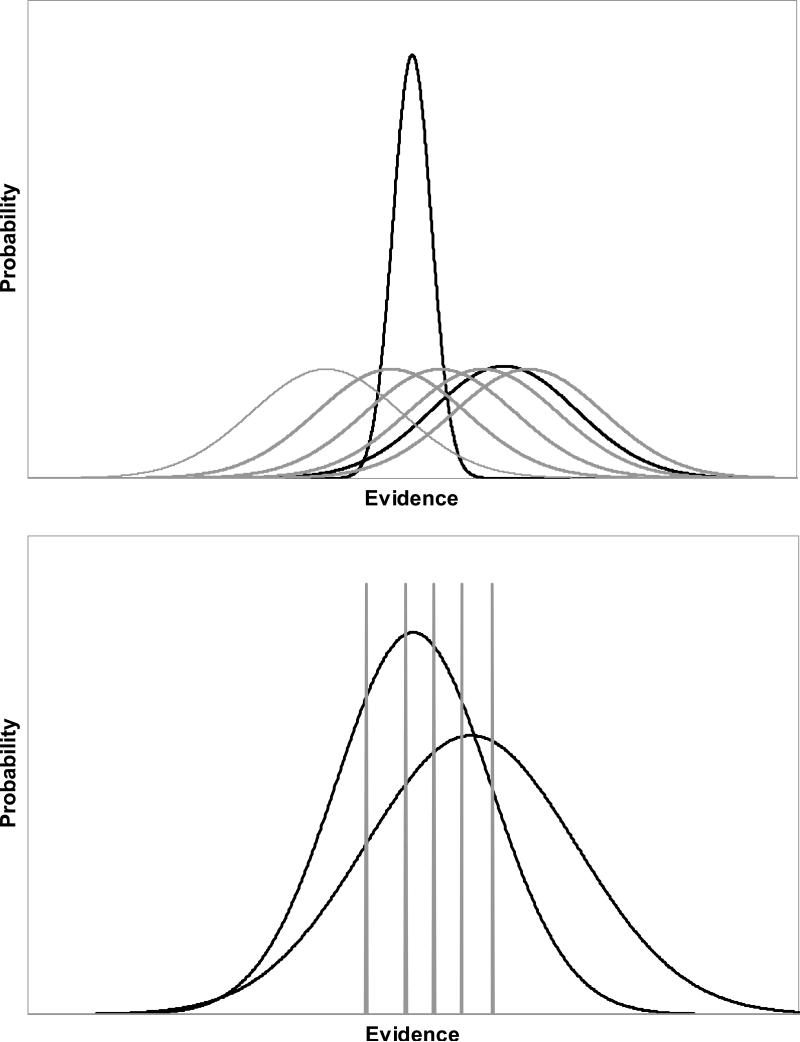
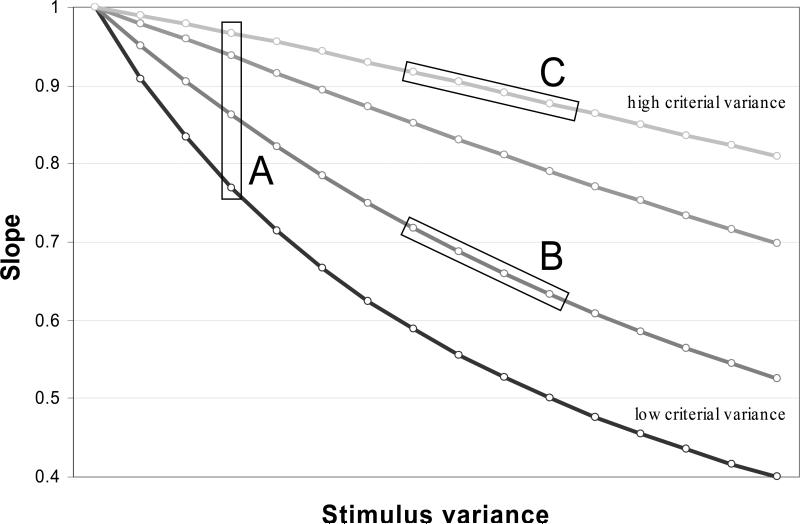
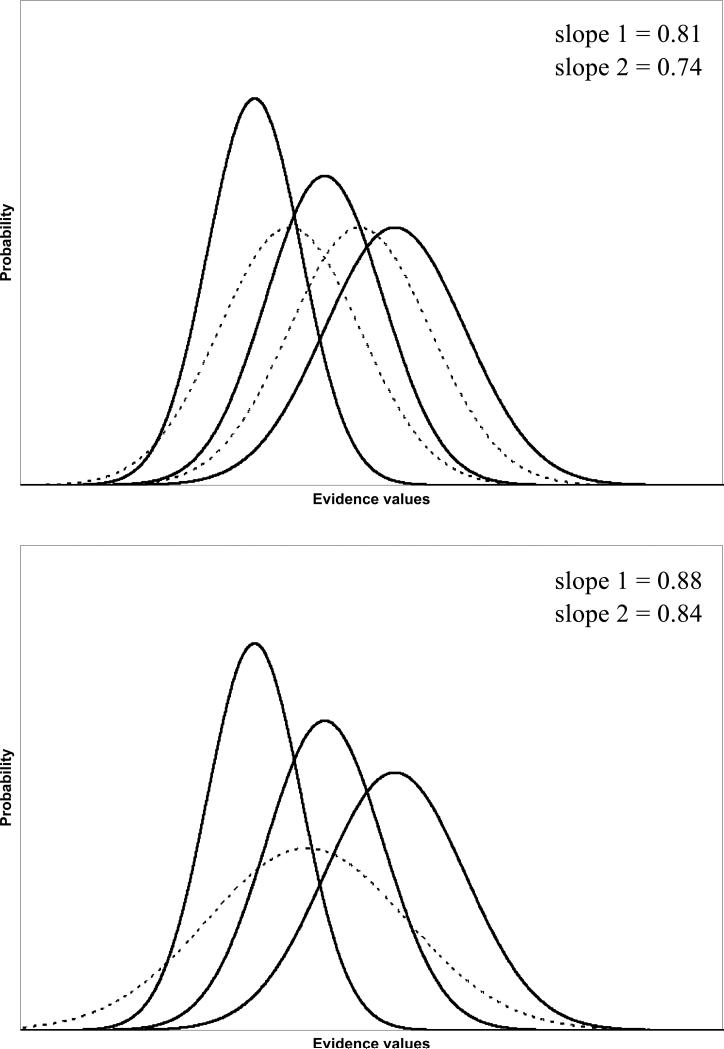
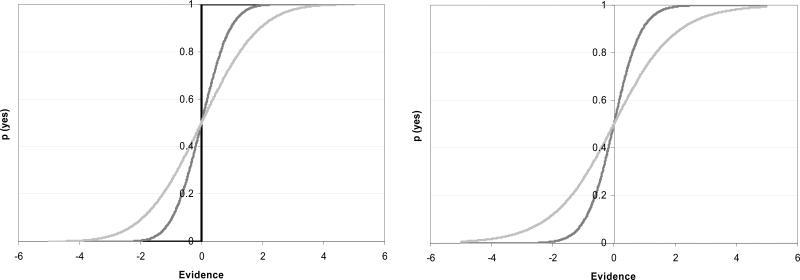
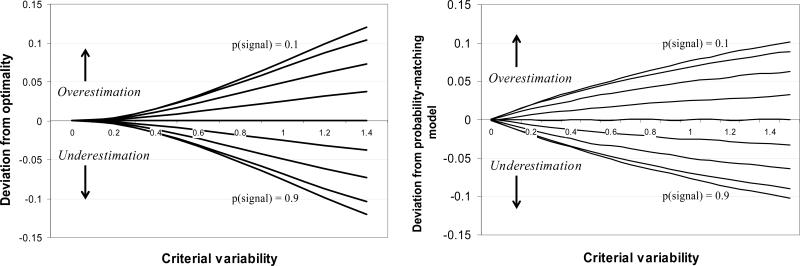
A tacit but fundamental assumption of the theory of signal detection is that criterion placement is a noise-free process. This article challenges that assumption on theoretical and empirical grounds and presents the noisy decision theory of signal detection (ND-TSD). Generalized equations for the isosensitivity function and for measures of discrimination incorporating criterion variability are derived, and the model's relationship with extant models of decision making in discrimination tasks is examined. An experiment evaluating recognition memory for ensembles of word stimuli revealed that criterion noise is not trivial in magnitude and contributes substantially to variance in the slope of the isosensitivity function. The authors discuss how ND-TSD can help explain a number of current and historical puzzles in recognition memory, including the inconsistent relationship between manipulations of learning and the isosensitivity function's slope, the lack of invariance of the slope with manipulations of bias or payoffs, the effects of aging on the decision-making process in recognition, and the nature of responding in remember-know decision tasks. ND-TSD poses novel, theoretically meaningful constraints on theories of recognition and decision making more generally, and provides a mechanism for rapprochement between theories of decision making that employ deterministic response rules and those that postulate probabilistic response rules.


Figures

Figure 1
Figure 1
Top panel: Traditional TSD representation of the recognition problem, including variable evidence distributions and a scalar criterion. Bottom panel: An alternative formulation with scalar evidence values and a variable criterion. Both depictions lead to equivalent performance.
Figure 2
Figure 2
Isosensitivity functions in probability coordinates (top row) and normal-deviate coordinates (bottom row) for increasing levels of criterial noise (indicated by increasingly light contours). Left panels illustrate the case when the variability of the signal (old item) distribution is less than that of the noise distribution (which has unit variance), middle panels for when they are equal in variance, and right panels for the (typical) case when the signal distribution is more variable than the noise distribution.
Figure 3
Figure 3
Predictions of the variability models of information integration for the relationship between ensemble size (n) and the shapes of the evidence distributions.
Figure 4
Figure 4
The multidimensional formulation of the OR model for information integration. Distributions are shown from above. Given a criterion value and performance on a single stimulus, the shaded area is equal to the complement of predicted performance on the joint stimulus.
Figure 5
Figure 5
Depiction of the results from the winning ND-TSD model (top panel) and traditional TSD (bottom panel). Dark lines are evidence distributions and lighter lines represent criteria.
Figure 6
Figure 6
Slope of the isosensitivity curve as a function of stimulus (ranging from 1 to 2.5) and criterion variance (ranging from 0 to 3).
Figure 7
Figure 7
A demonstration of how a manipulation of learning can lead to a difference in slope between conditions when subjects can successfully subclassify test stimuli (top panel) than when they can not (bottom panel).
Figure 8
Figure 8
Response functions for deterministic response rules (left panel) and probabilistic response rules (right panel). In the left panel, increasingly light lines indicate increasing criterial noise. Note that it is a step function when the criterion is nonvariable. In the right panel, the two functions represent two different response rules (see text for details). In all cases, the criterion is set at 0.
Figure 9
Figure 9
A demonstration of conservatism as a function of base rate manipulations. The left panel shows deviation from optimal responding; the right panel shows deviation from probability matching.

References

    1. Aggleton JP, Shaw C. Amnesia and recognition memory: A re-analysis of psychometric data. Neuropsychologia. 1996;34:51–62. - PubMed
    1. Akaike H. Information theory and an extension of the maximum likelihood principle. In: Petrov BN, Csaki F, editors. Second international symposium on information theory. Akademiai Kiado; Budapest: 1973. pp. 267–281.
    1. Arndt J, Reder LM. Word frequency and receiver operating characteristic curves in recognition memory: Evidence for a dual-process interpretation. Journal of Experimental Psychology: Learning, Memory, and Cognition. 2002;28:830–842. - PMC - PubMed
    1. Ashby FG, Maddox WT. Relations between prototype, exemplar, and decision bound models of categorization. Journal of Mathematical Psychology. 1993;37:372–400.
    1. Atkinson RC, Carterette EC, Kinchla RA. The effect of information feedback upon psychophysical judgments. Psychonomic Science. 1964;1:83–84.

Publication types