. 2009 Jan 21:10:39.
doi: 10.1186/1471-2164-10-39.

New DArT markers for oat provide enhanced map coverage and global germplasm characterization

Affiliations

New DArT markers for oat provide enhanced map coverage and global germplasm characterization

Nicholas A Tinker et al. BMC Genomics. .

Abstract

Background: Genomic discovery in oat and its application to oat improvement have been hindered by a lack of genetic markers common to different genetic maps, and by the difficulty of conducting whole-genome analysis using high-throughput markers. This study was intended to develop, characterize, and apply a large set of oat genetic markers based on Diversity Array Technology (DArT).

Results: Approximately 19,000 genomic clones were isolated from complexity-reduced genomic representations of pooled DNA samples from 60 oat varieties of global origin. These were screened on three discovery arrays, with more than 2000 polymorphic markers being identified for use in this study, and approximately 2700 potentially polymorphic markers being identified for use in future studies. DNA sequence was obtained for 2573 clones and assembled into a non-redundant set of 1770 contigs and singletons. Of these, 705 showed highly significant (Expectation < 10E-10) BLAST similarity to gene sequences in public databases. Based on marker scores in 80 recombinant inbred lines, 1010 new DArT markers were used to saturate and improve the 'Kanota' x 'Ogle' genetic map. DArT markers provided map coverage approximately equivalent to existing markers. After binning markers from similar clones, as well as those with 99% scoring similarity, a set of 1295 non-redundant markers was used to analyze genetic diversity in 182 accessions of cultivated oat of worldwide origin. Results of this analysis confirmed that major clusters of oat diversity are related to spring vs. winter type, and to the presence of major breeding programs within geographical regions. Secondary clusters revealed groups that were often related to known pedigree structure.

Conclusion: These markers will provide a solid basis for future efforts in genomic discovery, comparative mapping, and the generation of an oat consensus map. They will also provide new opportunities for directed breeding of superior oat varieties, and guidance in the maintenance of oat genetic diversity.


Figures

Figure 1
Figure 1
Sequence assembly. Assembly of 2670 DArT clone sequences showing (A) number of contig assemblies of different sizes and (B) number of sequences belonging to contigs of different size.
Figure 2
Figure 2
BLAST similarity. Number of non-redundant DArT clone sequences (consensus from contigs plus singletons) from a set of 1774 with BLAST hits having E-values smaller (more significant) than a given value when tested against the non-redundant nucleotide database (nt), the non-redundant protein database (nr), the EST database (est) or the concatenation of all three (all). All BLAST databases were downloaded from NCBI [33] on May 6, 2008, and searches were performed locally using BLASTX and BLASTN 2.2.18 [47]
Figure 3
Figure 3
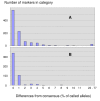
Markers with potential scoring errors. Frequency distribution of percent agreement between called alleles and consensus calls for DArT markers with clones belonging to multi-sequence contigs. For contigs with two members, this is the percent agreement with the other clone in the contig. Part (A) is based on diversity scores for 1015 clones belonging to 431 contigs, and part (B) is based on mapping scores for 485 clones belonging to 194 contigs.
Figure 4
Figure 4
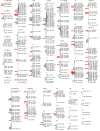
KxO Linkage map. A framework version of the new 'Kanota' × 'Ogle' linkage map showing placement of additional markers (cross-hairs). Vertical bars on cross-hairs indicate the tendency of a placed marker to stretch the interval. The bars are 1/4 of the length that the interval would be if the marker were placed at this position. Where the number of crosshairs exceeded ten they were replaced with a red arrow. A high-resolution multi-page version of this figure is presented in Additional file 7. Additional details and a complete listing of placed marker names are found in Additional file 8.
Figure 5
Figure 5
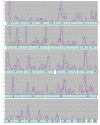
Marker clustering in linkage map. Smoothed density of markers within a 10 cM moving window on the 'Kanota' × 'Ogle' framework linkage map. The dark blue line shows the overall density of markers including DArT markers and those mapped prior to 2003. Magenta shows the distribution of DArT markers alone. The yellow line shows the density of AFLP markers mapped prior to 2003.
Figure 6
Figure 6
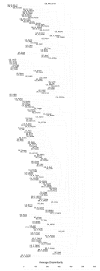
Cluster analysis of varieties. Agglomerative clustering using the un-weighted pair group method with averages (UPGMA) for 134 oat varieties using 1295 non-redundant DArT marker loci. Oat varieties are identified by truncated entry names, which are preceded by two-letter codes indicating country of origin, and by additional codes if they are winter-types (W), fall-sown but winter grown (F), or naked (N). See Additional file 1 for full entry names and country of origin codes. Clustering was implemented using the Agglomerative Nesting (AGNES) function in the R statistical environment [52]. The distance metric used was the Manhattan distance, which represents (in this case) the number of loci (out of 1295, adjusted for missing scores) for which two lines differed in their marker score. A high-resolution version of this figure is presented in Additional file 10.
Figure 7
Figure 7
Principle coordinate analysis (PCA). Plot of PCA axes 1 and 2 based on Manhattan distance calculations for 134 oat varieties using 1295 non-redundant DArT marker loci. Oat varieties are identified by truncated entry names, which are preceded by two-letter codes indicating country of origin, and by additional codes if they are winter-types (W), fall-sown but winter grown (F), or naked (N). See Additional file 1 for full entry names and country of origin codes. Selected counties of origin are coloured blue (Brazil), red (Canada), pink (Great Britain), light-blue (Norway), yellow (Sweden), purple (USA), or green (USA-Fall/Winter).

References

    1. Baum BR. Oats: wild and cultivated. A monograph of the genus Avena L. (Poaceae). Monograph No. 14. Ottawa, Canada: Biosystematics Research Institute (curently ECORC), Agriculture and Agri-Food Canada; 1977.
    1. Leggett JM. Classification and speciation in Avena. In: Sorrells ME, Marshall HG, editor. Oat Science and Technology, Agronomy Monograph 33. Madison, WI: American Society of Agronomy and Crop Science Society of America; 1992. pp. 29–52.
    1. Garris AJ, Tai TH, Coburn J, Kresovich S, McCouch S. Genetic structure and diversity in Oryza sativa L. Genetics. 2005;169:1631–1638. - PMC - PubMed
    1. Chao S, Zhang W, Dubcovsky J, Sorrells M. Evaluation of genetic diversity and genome-wide linkage disequilibrium among US wheat (Triticum aestivum L.) germplasm representing different market classes. Crop Sci. 2007;47:1018–1030.
    1. Fu YB, Peterson GW, Williams D, Richards KW, Fetch JM. Patterns of AFLP variation in a core subset of cultivated hexaploid oat germplasm. Theor Appl Genet. 2005;111:530–539. - PubMed

Publication types