

High-throughput, quantitative analyses of genetic interactions in E. coli
- PMID: 19160513
- PMCID: PMC2700713
- DOI: 10.1038/nmeth.1240
High-throughput, quantitative analyses of genetic interactions in E. coli
Abstract
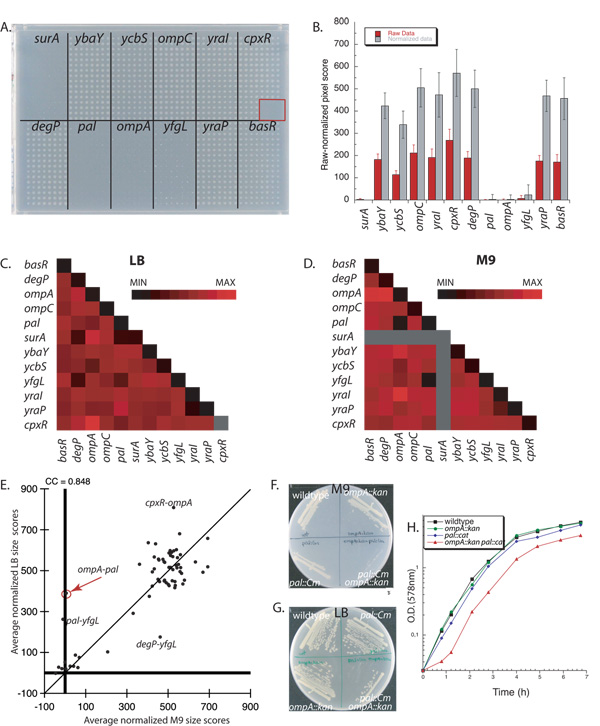
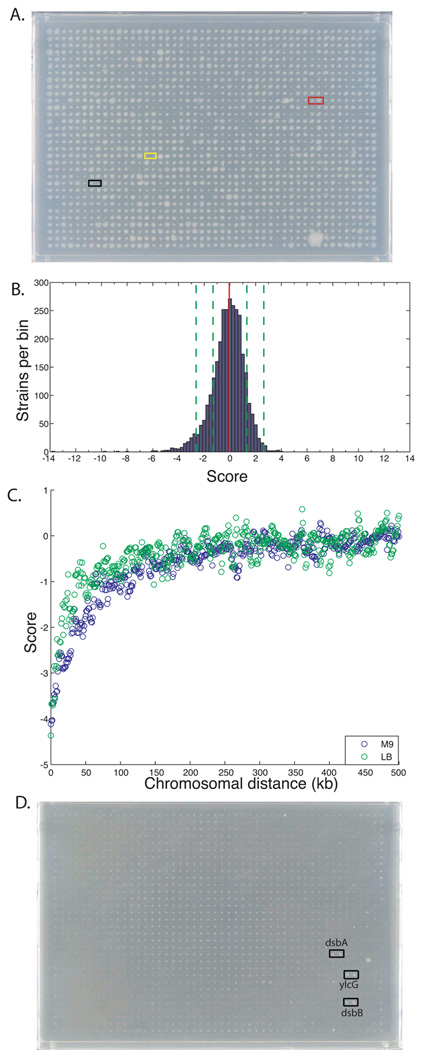
Large-scale genetic interaction studies provide the basis for defining gene function and pathway architecture. Recent advances in the ability to generate double mutants en masse in Saccharomyces cerevisiae have dramatically accelerated the acquisition of genetic interaction information and the biological inferences that follow. Here we describe a method based on F factor-driven conjugation, which allows for high-throughput generation of double mutants in Escherichia coli. This method, termed genetic interaction analysis technology for E. coli (GIANT-coli), permits us to systematically generate and array double-mutant cells on solid media in high-density arrays. We show that colony size provides a robust and quantitative output of cellular fitness and that GIANT-coli can recapitulate known synthetic interactions and identify previously unidentified negative (synthetic sickness or lethality) and positive (suppressive or epistatic) relationships. Finally, we describe a complementary strategy for genome-wide suppressor-mutant identification. Together, these methods permit rapid, large-scale genetic interaction studies in E. coli.
Figures


Comment in
-
Functional genomics: an array of bacterial interactions.Nat Rev Genet. 2008 Sep;9(9):652. doi: 10.1038/nrg2446. Nat Rev Genet. 2008. PMID: 21491639 No abstract available.
Similar articles
-
Array-based synthetic genetic screens to map bacterial pathways and functional networks in Escherichia coli.Methods Mol Biol. 2011;765:125-53. doi: 10.1007/978-1-61779-197-0_9. Methods Mol Biol. 2011. PMID: 21815091
-
Mapping bacterial functional networks and pathways in Escherichia Coli using synthetic genetic arrays.J Vis Exp. 2012 Nov 12;(69):4056. doi: 10.3791/4056. J Vis Exp. 2012. PMID: 23168417 Free PMC article.
-
Array-based synthetic genetic screens to map bacterial pathways and functional networks in Escherichia coli.Methods Mol Biol. 2011;781:99-126. doi: 10.1007/978-1-61779-276-2_7. Methods Mol Biol. 2011. PMID: 21877280
-
eSGA: E. coli synthetic genetic array analysis.Nat Methods. 2008 Sep;5(9):789-95. doi: 10.1038/nmeth.1239. Nat Methods. 2008. PMID: 18677321
-
Genomic investigations of evolutionary dynamics and epistasis in microbial evolution experiments.Curr Opin Genet Dev. 2015 Dec;35:33-9. doi: 10.1016/j.gde.2015.08.008. Epub 2015 Sep 14. Curr Opin Genet Dev. 2015. PMID: 26370471 Free PMC article. Review.
Cited by
-
Systematic triple-mutant analysis uncovers functional connectivity between pathways involved in chromosome regulation.Cell Rep. 2013 Jun 27;3(6):2168-78. doi: 10.1016/j.celrep.2013.05.007. Epub 2013 Jun 6. Cell Rep. 2013. PMID: 23746449 Free PMC article.
-
Hierarchical modularity and the evolution of genetic interactomes across species.Mol Cell. 2012 Jun 8;46(5):691-704. doi: 10.1016/j.molcel.2012.05.028. Mol Cell. 2012. PMID: 22681890 Free PMC article.
-
High-resolution network biology: connecting sequence with function.Nat Rev Genet. 2013 Dec;14(12):865-79. doi: 10.1038/nrg3574. Epub 2013 Nov 7. Nat Rev Genet. 2013. PMID: 24197012 Free PMC article. Review.
-
Rapid prototyping of microbial cell factories via genome-scale engineering.Biotechnol Adv. 2015 Nov 15;33(7):1420-32. doi: 10.1016/j.biotechadv.2014.11.007. Epub 2014 Nov 20. Biotechnol Adv. 2015. PMID: 25450192 Free PMC article. Review.
-
CRISPRi-TnSeq maps genome-wide interactions between essential and non-essential genes in bacteria.Nat Microbiol. 2024 Sep;9(9):2395-2409. doi: 10.1038/s41564-024-01759-x. Epub 2024 Jul 19. Nat Microbiol. 2024. PMID: 39030344 Free PMC article.
References
-
- Boone C, Bussey H, Andrews BJ. Exploring genetic interactions and networks with yeast. Nat Rev Genet. 2007;8:437–449. - PubMed
-
- Tong AH, et al. Systematic genetic analysis with ordered arrays of yeast deletion mutants. Science. 2001;294:2364–2368. - PubMed
-
- Tong AH, et al. Global mapping of the yeast genetic interaction network. Science. 2004;303:808–813. - PubMed
-
- Pan X, et al. A robust toolkit for functional profiling of the yeast genome. Mol Cell. 2004;16:487–496. - PubMed
-
- Collins SR, et al. Functional dissection of protein complexes involved in yeast chromosome biology using a genetic interaction map. Nature. 2007 - PubMed
Publication types
MeSH terms
Grants and funding
LinkOut - more resources
Full Text Sources
Other Literature Sources
Research Materials
