. 2008 Sep;5(9):805-11.
doi: 10.1038/nmeth.1243.

A genetically encoded calcium indicator for chronic in vivo two-photon imaging

Affiliations

A genetically encoded calcium indicator for chronic in vivo two-photon imaging

Marco Mank et al. Nat Methods. 2008 Sep.

Abstract

Neurons in the nervous system can change their functional properties over time. At present, there are no techniques that allow reliable monitoring of changes within identified neurons over repeated experimental sessions. We increased the signal strength of troponin C-based calcium biosensors in the low-calcium regime by mutagenesis and domain rearrangement within the troponin C calcium binding moiety to generate the indicator TN-XXL. Using in vivo two-photon ratiometric imaging, we show that TN-XXL exhibits enhanced fluorescence changes in neurons of flies and mice. TN-XXL could be used to obtain tuning curves of orientation-selective neurons in mouse visual cortex measured repeatedly over days and weeks. Thus, the genetically encoded calcium indicator TN-XXL allows repeated imaging of response properties from individual, identified neurons in vivo, which will be crucial for gaining new insights into cellular mechanisms of plasticity, regeneration and disease.


Conflict of interest statement

Competing interests statement

The authors declare competing financial interests: details accompany the full-text HTML version of the paper at http://www.nature.com/naturemethods/.

Figures

Figure 1
Figure 1. Generation and in vitro characterization of TN-XXL.
(a) Schematic representation of domain rearrangement and mutagenesis used to develop TN-XXL. The indicator is drawn as a linear sequence with four loops with roman numerals indicating EF hands I–IV of chicken skeletal muscle troponin C (csTnC). Blue and yellow lines at N- and C-terminal positions represent the fusion of CFP and Citrine cp174 to csTnC. Amino acid residues determined to be optimal as start and end points for domain doubling (Ser94 and Gln162), mutations within EF hand III to abolish magnesium binding (mutations N108D and D110N) and one helix-stabilizing mutation to increase calcium affinity of the C-terminal lobe (I130T) are indicated. All numbering of amino acid residues refers to the wild-type sequence of csTnC. Domain rearrangement involved the deletion of the N-terminal lobe (gray line) of csTnC, containing EF hands I and II (middle row), and the doubling, connected by means of a short linker (orange, bottom row), of the C-terminal lobe (black line) between Ser94 and Gln162. (b) Calcium titration of TN-XXL, TN-L15 and TN-XL. The resulting Kd values are 710 nM (TN-L15), 2.2 μM (TN-XL) and 800 nM (TN-XXL) (n = 4; error bars, mean ± s.d.). (c) Corresponding signal strengths (in ΔR/R (%)) (n = 4; mean ± s.d.) of the three biosensors given as a function of free calcium in vitro. ΔR/R values are calculated according to the peak values of donor (475 nm) and acceptor (527 nm) fluorescence and the ratio obtained at 0 nM free calcium.
Figure 2
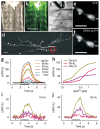
Figure 2. In vivo two-photon imaging and calibration of TN-XXL in Drosophila motor neuron boutons.
(a) Bright-field image of a filet preparation of a Drosophila larva. Scale bar, 1 mm. (b) Same field of view taken by epifluor-escence excitation. Pan-neuronal TN-XXL expression fluorescently labels the entire nervous system: brain (b), ventral nerve cord (v), and nerves innervating individual body segments (sn). (c) Close-up on larval body wall muscle 6/7 (m), exemplifying the recording situation in a rostral abdominal segment. The cut end of the intersegmental nerve (sn) was placed in a suction electrode (el) for electrical stimulation of presynaptic motor neuron endings. Scale bar, 50 μm. (d) Two-photon excitation of TN-XXL fluorescence at a neuromuscular junction on muscle 6/7 (collapsed image stack taken by two-photon microscopy). Axons and type Is and Ib boutons are labeled by bright TN-XXL fluorescence. In contrast, there is no fluorescence signal detectable from the muscles. Scale bar, 10 μm. (e,f) Two-photon excitation and close-up on two presynaptic boutons, marked by the red box in d, showing CFP fluorescence (e) and simultaneously imaged Citrine cp174 (f). Scale bars, 5 μm. (g) TN-XXL fluorescence changes in presynaptic boutons increase with action potential frequency (0–160 Hz, 2 s; black stimulus bar). Fractional fluorescence changes of the Citrine cp174/CFP ratio (ΔR/R) are plotted as a function of time. (h–j) Comparison of ΔR/R in three different TnC-based calcium indicators: TN-L15, TN-XL and the new TN-XXL. (h) Maximum ΔR/R at steady state plotted as a function of Δ[Ca2+]i (action potential frequency was translated into Δ[Ca2+]i per ref. 23). (i,j) ΔR/R plotted as a function of time at 10 Hz (i) and 20 Hz (j) stimulation. Genotype: elavC155-GAL4/elavC155-GAL4; UAS-TN-XXL/UAS-TN-XXL. Sample sizes: 52 < n < 60 type Ib boutons.
Figure 3
Figure 3. Imaging stimulus-evoked TN-XXL signals in mouse visual cortex.
(a) Schematic of the mouse visual system and stimulus presentation. Moving gratings of different orientations were displayed on a screen in front of the mouse, contralateral to the imaged visual cortex. (b) Schematic of experimental approach for in vivo two-photon imaging from mouse visual cortex. (c) Left, in vivo two-photon image of a recombinant SFV–infected pyramidal neuron expressing TN-XXL (average of 200 frames), 275 μm below the cortical surface. Right, dendrites and spines from this cell at a depth 120 μm. Scale bars, 10 μm. (d) Average (six trials) change in fluorescence (ΔF/F) of Citrine cp174 and CFP during visual stimulation (gray bars). Stimulus orientation and direction are indicated by the symbols at the top. Note opposite sign of signal change in both channels during stimulation with horizontal gratings. (e) Average and single-trial responses of the ratiometric signal (ΔR/R). (f) Orientation tuning curve of the imaged neuron.
Figure 4
Figure 4. Comparison of responses to drifting grating stimuli in neurons expressing TN-XXL and OGB-1 AM.
(a) The distribution of preferred orientations for responsive neurons. For example, a preferred angle of 0° indicates that a neuron responded most vigorously to a horizontal grating drifting in an upward or downward direction. Each category (0°, 45°, 90°, 135°) includes neurons which were tuned to orientations ± 25° from the stated value. Note the bias for horizontal (0°) gratings in both TN-XXL and OGB-1 AM neurons. (b) The distribution of the width of orientation tuning. Each value represents the half-width at half-maximum response of fitted tuning curves. Horizontal lines indicate mean values.
Figure 5
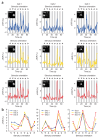
Figure 5. Repeated imaging of sensory-evoked calcium signals using TN-XXL.
(a) Visually evoked calcium transients imaged in three in utero–electroporated, TN-XXL–expressing neurons at successive time points (averages of 6 trials for cells 1 and 2 at all time points; averages of 15, 10 and 35 trials for cell 3 on days 1, 12 and 19, respectively). Scale bar, 10 μm. (b) Orientation tuning curves from neurons in a obtained on different days after start of the experiment. Note stable tuning over time in all cells.

References

    1. Kerr JND, Denk W. Imaging in vivo: watching the brain in action. Nat Rev Neurosci. 2008;9:195–205. - PubMed
    1. Stosiek C, Garaschuk O, Holthoff K, Konnerth A. In vivo two-photon calcium imaging of neuronal networks. Proc Natl Acad Sci USA. 2003;100:7319–7324. doi: 10.1073/pnas.1232232100. - DOI - PMC - PubMed
    1. Kerr JND, Greenberg D, Helmchen F. Imaging input and output of neocortical networks in vivo. Proc Natl Acad Sci USA. 2005;102:14063–14068. doi: 10.1073/pnas.0506029102. - DOI - PMC - PubMed
    1. Ohki K, Chung S, Ch’Ng YH, Kara P, Reid RC. Functional imaging with cellular resolution reveals precise micro-architecture in visual cortex. Nature. 2005;433:597–603. - PubMed
    1. Ohki K, et al. Highly ordered arrangement of single neurons in orientation pinwheels. Nature. 2006;442:925–928. - PubMed

Publication types

Associated data

LinkOut - more resources