

An open access database of genome-wide association results
- PMID: 19161620
- PMCID: PMC2639349
- DOI: 10.1186/1471-2350-10-6
An open access database of genome-wide association results
Abstract
Background: The number of genome-wide association studies (GWAS) is growing rapidly leading to the discovery and replication of many new disease loci. Combining results from multiple GWAS datasets may potentially strengthen previous conclusions and suggest new disease loci, pathways or pleiotropic genes. However, no database or centralized resource currently exists that contains anywhere near the full scope of GWAS results.
Methods: We collected available results from 118 GWAS articles into a database of 56,411 significant SNP-phenotype associations and accompanying information, making this database freely available here. In doing so, we met and describe here a number of challenges to creating an open access database of GWAS results. Through preliminary analyses and characterization of available GWAS, we demonstrate the potential to gain new insights by querying a database across GWAS.
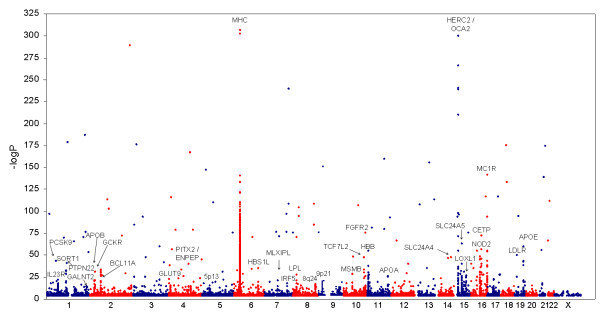
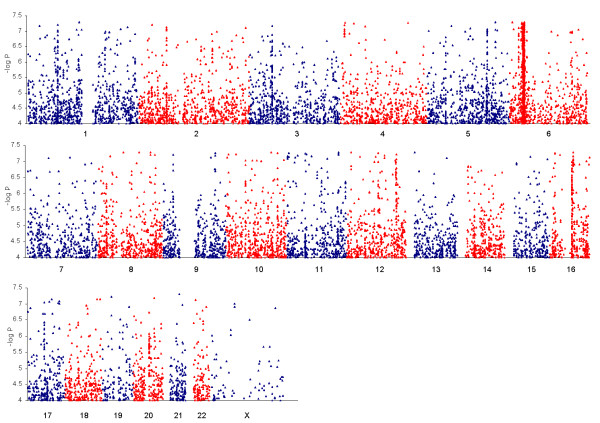
Results: Using a genomic bin-based density analysis to search for highly associated regions of the genome, positive control loci (e.g., MHC loci) were detected with high sensitivity. Likewise, an analysis of highly repeated SNPs across GWAS identified replicated loci (e.g., APOE, LPL). At the same time we identified novel, highly suggestive loci for a variety of traits that did not meet genome-wide significant thresholds in prior analyses, in some cases with strong support from the primary medical genetics literature (SLC16A7, CSMD1, OAS1), suggesting these genes merit further study. Additional adjustment for linkage disequilibrium within most regions with a high density of GWAS associations did not materially alter our findings. Having a centralized database with standardized gene annotation also allowed us to examine the representation of functional gene categories (gene ontologies) containing one or more associations among top GWAS results. Genes relating to cell adhesion functions were highly over-represented among significant associations (p < 4.6 x 10(-14)), a finding which was not perturbed by a sensitivity analysis.
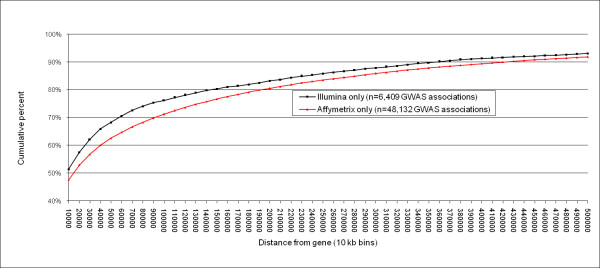
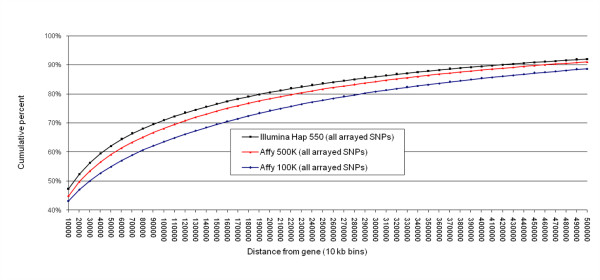
Conclusion: We provide access to a full gene-annotated GWAS database which could be used for further querying, analyses or integration with other genomic information. We make a number of general observations. Of reported associated SNPs, 40% lie within the boundaries of a RefSeq gene and 68% are within 60 kb of one, indicating a bias toward gene-centricity in the findings. We found considerable heterogeneity in information available from GWAS suggesting the wider community could benefit from standardization and centralization of results reporting.
Figures
References
-
- Chanock SJ, Manolio T, Boehnke M, Boerwinkle E, Hunter DJ, Thomas G, Hirschorn JN, Abecasis G, Altshuler D, Bailey-Wilson JE, Brooks LD, Cardon LR, Daly M, Donnelly P, Fraumeni JF, Freimer NB, Gerhard DS, Gunter C, Guttmacher AE, Guyer MS, Harris EL, Hoh J, Hoover R, Kong CA, Merikangas KR, Morton CC, Palmer LJ, Phimister EG, Rice JP, Roberts J, et al. Replicating genotype-phenotype associations. Nature. 2007;447:655–660. doi: 10.1038/447655a. - DOI - PubMed
-
- Mailman MD, Feolo M, Jin Y, Kimura M, Tryka K, Bagoutdinov R, Hao L, Kiang A, Paschall J, Phan L, Popova N, Pretel S, Ziyabari L, Lee M, Shao Y, Wang ZY, Sirotkin K, Ward M, Kholodov M, Zbicz K, Beck J, Kimelman M, Shevelev S, Preuss D, Yaschenko E, Graeff A, Ostell J, Sherry ST. The NCBI dbGaP database of genotypes and phenotypes. Nat Genet. 2007;39:1181–1186. doi: 10.1038/ng1007-1181. - DOI - PMC - PubMed
Publication types
MeSH terms
Grants and funding
LinkOut - more resources
Full Text Sources
Other Literature Sources
Research Materials
Miscellaneous
