Review
. 2009 Feb;8(2):165-74.
doi: 10.1016/S1474-4422(09)70013-4.

Cerebral microbleeds: a guide to detection and interpretation

Collaborators, Affiliations
Review

Cerebral microbleeds: a guide to detection and interpretation

Steven M Greenberg et al. Lancet Neurol. 2009 Feb.

Abstract

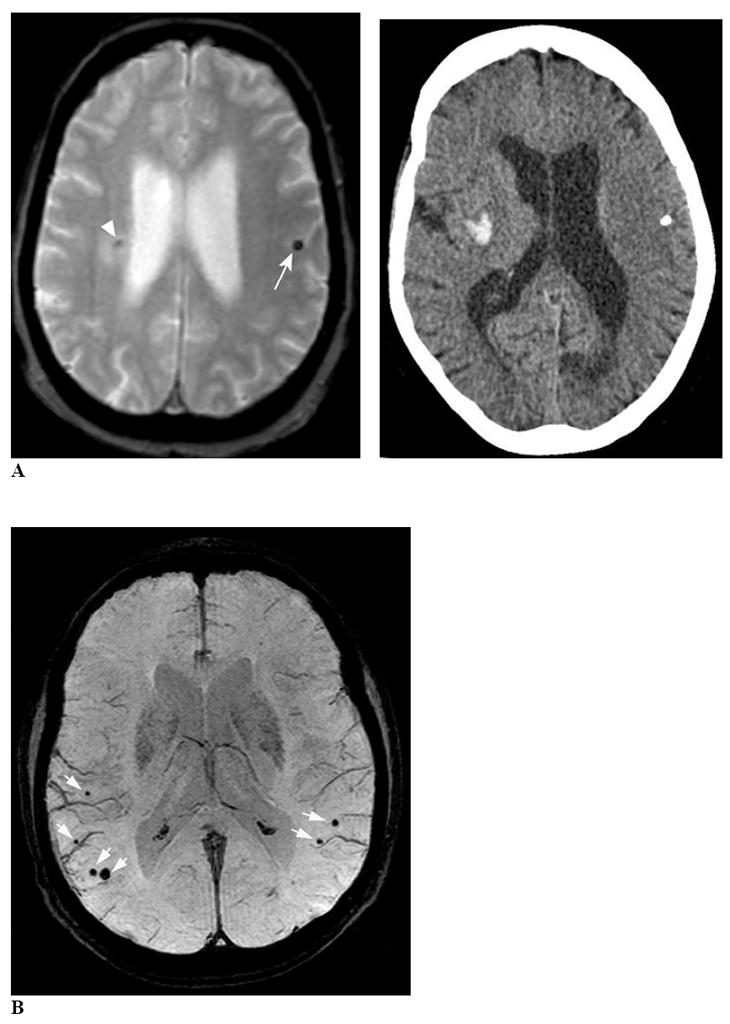
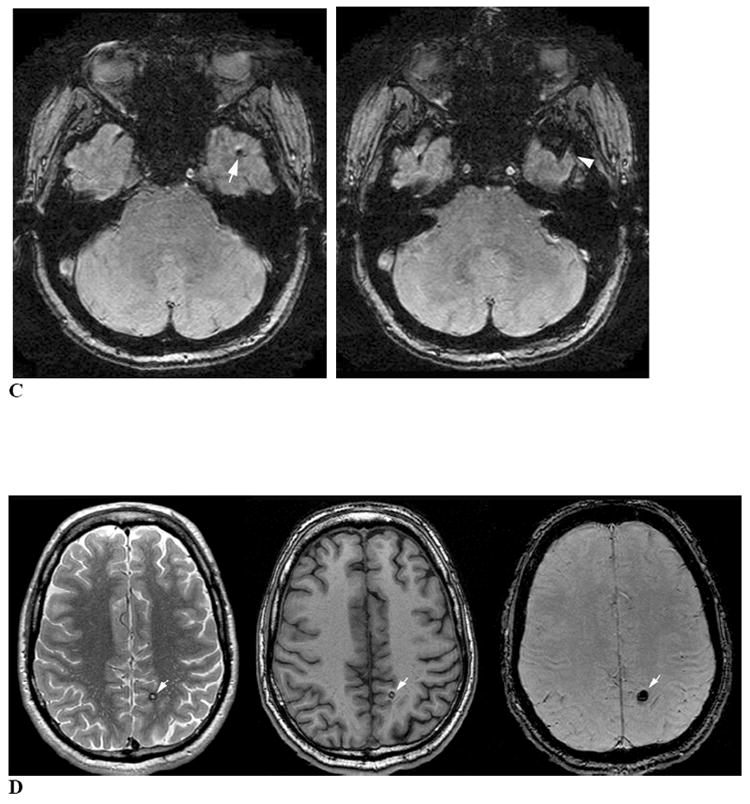
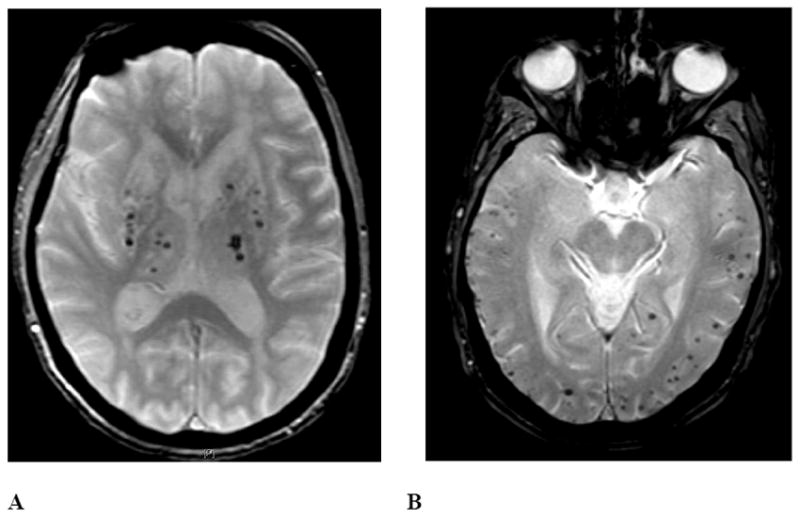
Cerebral microbleeds (CMBs) are increasingly recognised neuroimaging findings in individuals with cerebrovascular disease and dementia, and in normal ageing. There has been substantial progress in the understanding of CMBs in recent years, particularly in the development of newer MRI methods for the detection of CMBs and the application of these techniques to population-based samples of elderly people. In this Review, we focus on these recent developments and their effects on two main questions: how CMBs are detected, and how CMBs should be interpreted. The number of CMBs detected depends on MRI characteristics, such as pulse sequence, sequence parameters, spatial resolution, magnetic field strength, and image post-processing, emphasising the importance of taking into account MRI technique in the interpretation of study results. Recent investigations with sensitive MRI techniques have indicated a high prevalence of CMBs in community-dwelling elderly people. We propose a procedural guide for identification of CMBs and suggest possible future approaches for elucidating the role of these common lesions as markers for, and contributors to, small-vessel brain disease.


Conflict of interest statement

Conflicts of Interest

The authors have no conflicts of interest relevant to the contents of the submitted manuscript.

Figures

Figure 1
Figure 1. Increased conspicuity of CMB with T2*-weighted MRI techniques
Panel A compares T2 fast SE (left) and T2*-weighted MRI (right) imaging of the same CMB, shown at high magnification. The blooming effect is demonstrated by the larger area of signal void on the T2*-weighted MRI compared to the fast SE image. The GRE image also illustrates the ringing artifact as an area of high signal within the signal void. Panel B compares images obtained at corresponding axial levels using a conventional 2D sequence T2*-weighted MRI (left; TR/TE 775/20, flip angle 25°, voxel size 0.5×0.5×5 mm3) versus an accelerated 3D T2*-weighted MRI sequence (right; TR/TE 45/31, flip angle 13°, voxel size 0.5×0.5×0.8 mm3). Magnifications of matching brain regions are shown at bottom. The 3D T2*-weighted MRI image demonstrates three CMB in lobar locations (white arrows) that are not or barely discernible on the 2D T2*-weighted MRI image.
Figure 2
Figure 2. CMB confounds and mimics
Panel A, left is an axial T2*-weighted MRI image showing a calcification in the left hemisphere (arrow) mimicking a CMB. The CT scan (right) demonstrates this lesion as an area of very high density. Note that the MRI also shows a right hemispheric hypointense lesion (arrowhead) surrounded by hyperintense signal, corresponding to the tip of a spontaneous intracerebral hemorrhage demonstrated on the CT image. Panel B uses a minimum intensity projection of an axial T2*-weighted MRI image (4 mm slab) to illustrate CMB (white arrows) in proximity to vessel flow voids on the brain surface. The vessels can be distinguished from CMB by their linear shape, while the CMB appear as blind-ended round or ovoid structures. Panel C is an axial T2*-weighted MRI image demonstrating partial volume artifact as a potential CMB mimic. The axial T2*-weighted MRI image on the left shows a round focus of signal loss (arrow) that could be interpreted as a left temporal CMB. The image just caudal to this (right) indicates that this hypointensity is due to partial volume artifact from the adjacent left sphenoid bone (arrowhead). Panel D shows axial proton density-weighted (left), T1-weighted (middle) and T2*-weighted MRI (right) images depicting a cavernous malformation (white arrows) mimicking a CMB. The hyperintense signal within the hypointense rim on proton density or T2-weighted sequences helps distinguish these lesions from CMB.
Figure 3
Figure 3. Deep hemispheric and isolated lobar patterns of CMB distribution
The left panel represents a T2*-weighted MRI image from an 84-year-old woman with long-standing hypertension. CMB are present predominantly in the bilateral thalamus, putamen, caudate, and cerebellum, with only a small number in lobar brain regions (not shown in this image). The right panel is from a 77-year-old woman without hypertension. CMB are present only in lobar brain regions, meeting criteria for probable CAA.

Similar articles

Cited by

References

    1. Offenbacher H, Fazekas F, Schmidt R, Koch M, Fazekas G, Kapeller P. MR of cerebral abnormalities concomitant with primary intracerebral hematomas. AJNR Am J Neuroradiol. 1996;17(3):573–578. - PMC - PubMed
    1. Roob G, Schmidt R, Kapeller P, Lechner A, Hartung HP, Fazekas F. MRI evidence of past cerebral microbleeds in a healthy elderly population. Neurology. 1999;52(5):991–4. - PubMed
    1. Sveinbjornsdottir S, Sigurdsson S, Aspelund T, et al. Cerebral microbleeds in the population based AGES Reykjavik study: Prevalence and location. J Neurol Neurosurg Psychiatry. 2008;79:1002–1006. - PMC - PubMed
    1. Vernooij MW, van der Lugt A, Ikram MA, et al. Prevalence and risk factors of cerebral microbleeds: the Rotterdam Scan Study. Neurology. 2008;70(14):1208–14. - PubMed
    1. Koennecke HC. Cerebral microbleeds on MRI: prevalence, associations, and potential clinical implications. Neurology. 2006;66(2):165–71. - PubMed