. 2009 Apr;101(4):1921-31.
doi: 10.1152/jn.91157.2008. Epub 2009 Jan 21.

Triggering slow waves during NREM sleep in the rat by intracortical electrical stimulation: effects of sleep/wake history and background activity

Affiliations

Triggering slow waves during NREM sleep in the rat by intracortical electrical stimulation: effects of sleep/wake history and background activity

Vladyslav V Vyazovskiy et al. J Neurophysiol. 2009 Apr.

Abstract

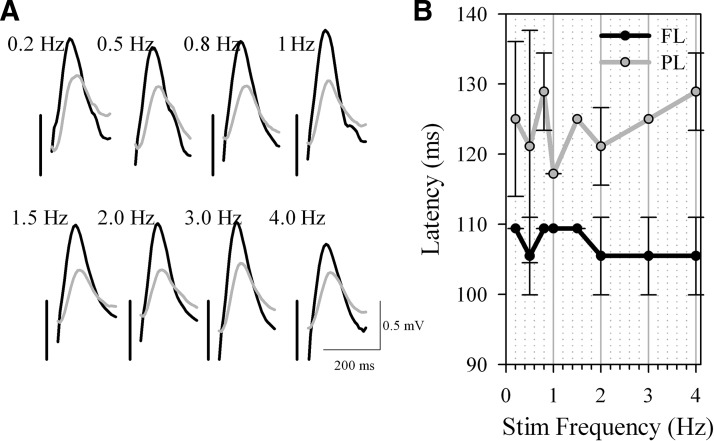
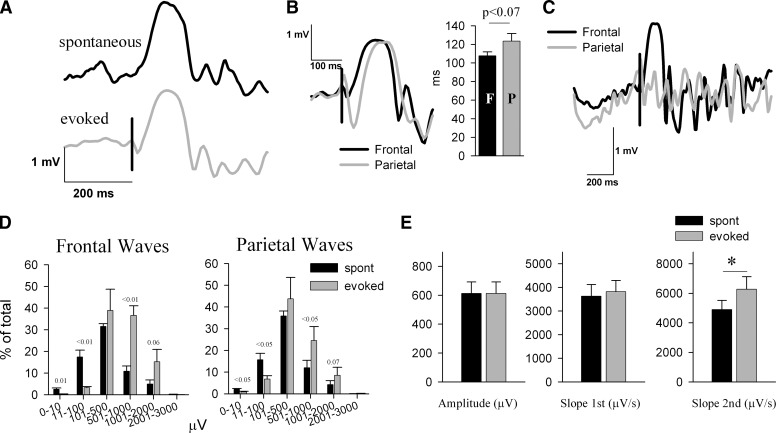
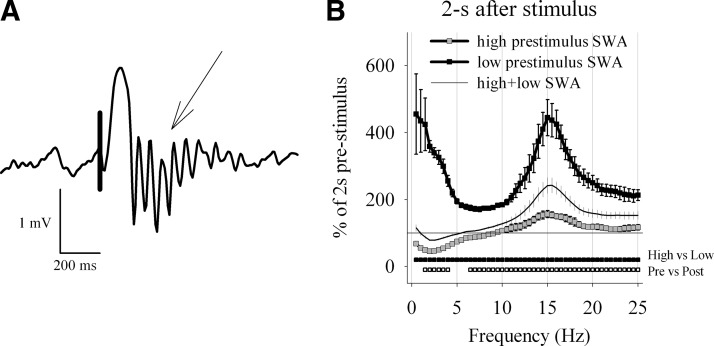
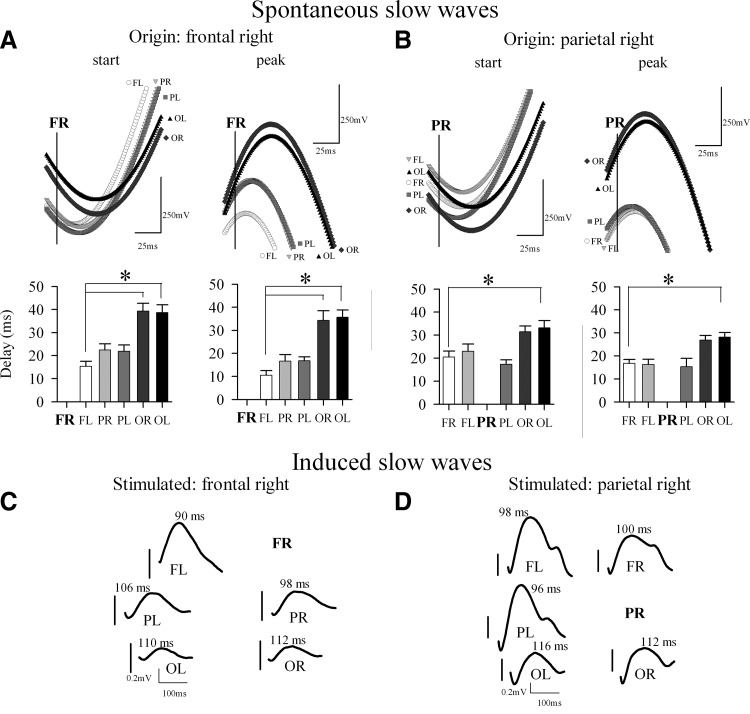
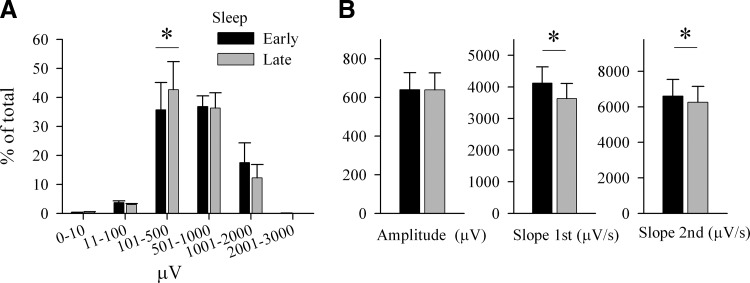
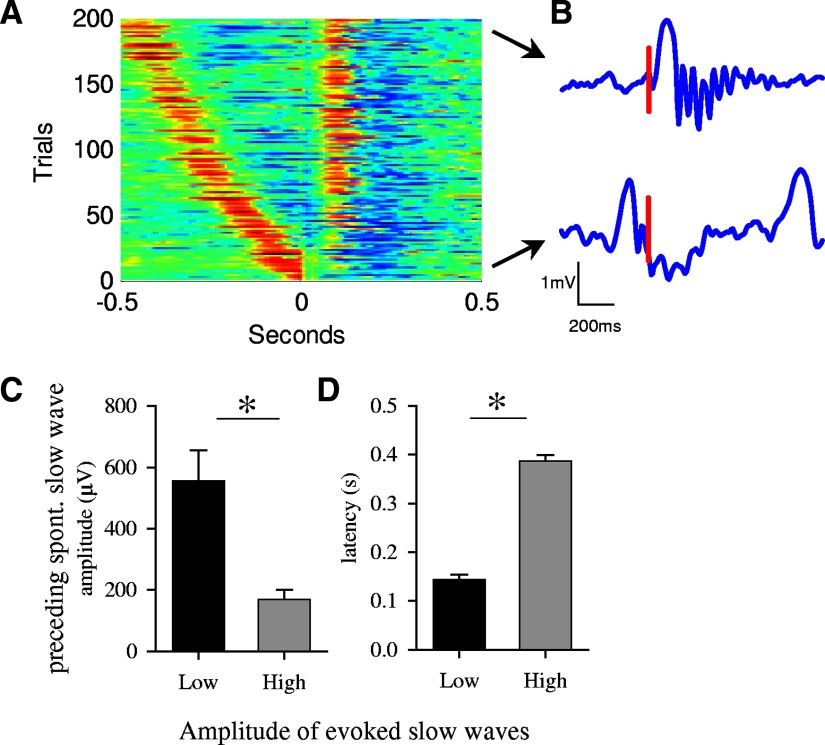
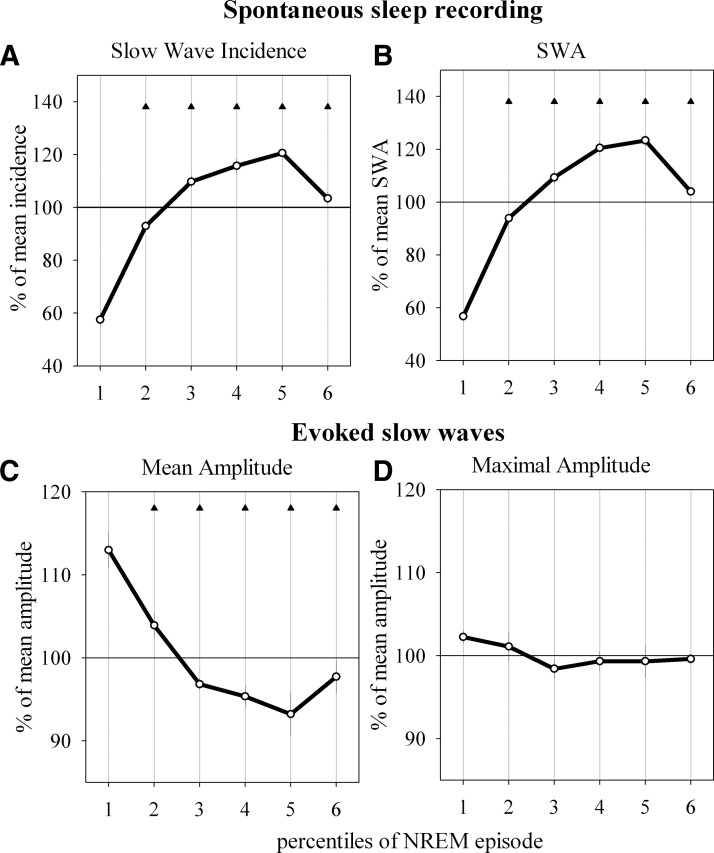
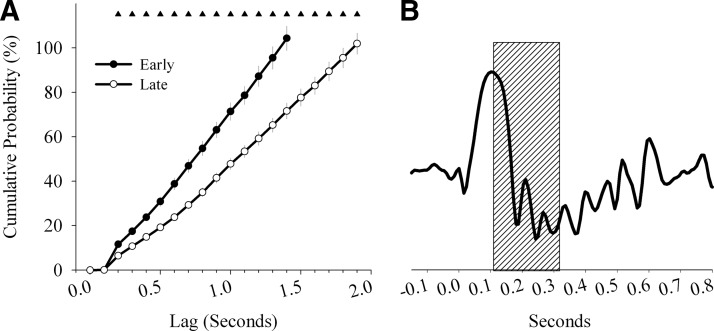
In humans, non-rapid eye movement (NREM) sleep slow waves occur not only spontaneously but can also be induced by transcranial magnetic stimulation. Here we investigated whether slow waves can also be induced by intracortical electrical stimulation during sleep in rats. Intracortical local field potential (LFP) recordings were obtained from several cortical locations while the frontal or the parietal area was stimulated intracortically with brief (0.1 ms) electrical pulses. Recordings were performed in early sleep (1st 2-3 h after light onset) and late sleep (6-8 h after light onset). The stimuli reliably triggered LFP potentials that were visually indistinguishable from naturally occurring slow waves. The induced slow waves shared the following features with spontaneous slow waves: they were followed by spindling activity in the same frequency range ( approximately 15 Hz) as spontaneously occurring sleep spindles; they propagated through the neocortex from the area of the stimulation; and compared with late sleep, waves triggered during early sleep were larger, had steeper slopes and fewer multipeaks. Peristimulus background spontaneous activity had a profound influence on the amplitude of the induced slow waves: they were virtually absent if the stimulus was delivered immediately after the spontaneous slow wave. These results show that in the rat a volley of electrical activity that is sufficiently strong to excite and recruit a large cortical neuronal population is capable of inducing slow waves during natural sleep.


Figures

FIG. 1.
FIG. 1.
Local intracortical electrical stimulation of the right frontal cortex triggers contralateral slow waves. In n = 2 animals, electrical pulses were delivered at various frequencies between 0.2 and 4.0 Hz during spontaneous nonrapid-eye-movement (NREM) sleep. A: the evoked slow waves recorded from the frontal left (black traces) and the parietal left (gray traces) cortical area. Traces are averages of ∼30 trials. Positivity –upward. Vertical bars indicate the timing of the trigger. B: mean ± SD (n = 2) latency to the peak of the frontal (FL) and parietal (PL) slow waves. Note that the parietal waves occurred with a consistent delay compared with the frontal waves.
FIG. 2.
FIG. 2.
Comparison between evoked and spontaneous sleep slow waves. A: individual traces depicting typical spontaneous (black) and evoked (gray) slow waves from 1 representative rat. Positivity –upward. Vertical bar denotes the timing of the trigger. B: individual traces of the evoked slow waves recorded from the contralateral frontal (black traces) and the ipsilateral parietal (gray traces) cortical area. Bar plot refers to mean ± SE values (n = 6) of the latency (in ms) from the trigger to the peak of the evoked slow waves. C: intracortical electrical stimulation of the right frontal cortex triggers in some cases a local contralateral slow wave. Individual traces from the contralateral frontal (black) and ipsilateral parietal (gray traces) cortical area, where no definable slow wave was elicited. Vertical bar denotes the timing of the trigger. D: distribution of the amplitude of spontaneous and evoked slow waves. The number of waves was computed for groups with logarithmically increasing amplitude. Mean ± SE values (n = 6) are plotted as percentage of the total number of waves. The numbers above the bars denote significance or a tendency level of statistical difference between spontaneous and evoked slow waves (paired t-test). E: mean ± SE values (n = 6) of peak amplitude, and slopes of the 1st and 2nd segments of spontaneous and evoked frontal slow waves. Evoked and spontaneous slow waves were matched by their amplitude. (asterisk, P < 0.05, paired t-test).
FIG. 3.
FIG. 3.
Evoked slow waves are associated with spindles. A: individual trace depicting a typical evoked slow wave followed by a prominent spindle (↓). Positivity –upward. B: relative electroencephalographic (EEG) power density (0.5-Hz resolution) in the 2-s intervals immediately following the trigger, represented as percentage of the EEG power during the 2 s immediately preceding the trigger. The curves represent mean values of EEG power (±SE, n = 6). The spectra are computed separately for those trials that occurred on the background of the LFP signal with low slow wave activity (SWA; lowest 25%, = “low,” ▪) and high SWA (top 25% = “high,” ). Thin line depicts the average spectrum over all trials. ▪ below the curves depict those frequency bins where poststimulus EEG power was significantly different between high and low prestimulus SWA (paired t-test, P < 0.05). below the curves depict those frequency bins where EEG power was significantly different from prestimulus values (paired t-test, P < 0.05).
FIG. 4.
FIG. 4.
Spontaneous and induced slow waves during NREM sleep propagate across multiple cortical locations. A, top: the start or the peak of the average spontaneous slow waves recorded from the left frontal (FL), right and left parietal (PR and PL, respectively) and occipital (OR and OL, respectively) derivations aligned relative to the start or the peak of the origin slow wave in the right frontal derivation (FR), indicated with a vertical line. Bottom panels: Average delays from the start or the peak of the origin slow wave relative to the start or the peak, respectively, of the next slow wave within the 1st 50 ms in other 5 cortical derivations. Mean ± SE values, n = 6. B: same as in A but for the origin slow wave in the right parietal derivation (PR). The gray shadings of the symbols in the top panels correspond to the fill colors of the bar plots in the bottom panels. C and D: local intracortical electrical stimulation of the right frontal cortex (C) or the right parietal cortex (D) triggers slow waves in the remaining five locations (abbreviations as above). Average traces of one individual rat. Note different y axis in C and D. Vertical bars indicate the timing of the trigger for each individual location. Positivity –upward. Numbers above the traces denote the latency of the peak (in ms) in relation to the trigger. Note the sequential propagation of the evoked slow waves across cortical regions.
FIG. 5.
FIG. 5.
Effect of sleep/wake history on the parameters of evoked slow waves. A: distribution of the amplitude of evoked slow waves. The number of waves was computed for groups with logarithmically increasing amplitude. Mean ± SE values (n = 6) are plotted as percentage of the total number of waves within a condition (early sleep, late sleep). * above the bars depicts significant difference (P < 0.05, paired t-test) between early and late sleep (paired t-test). B: mean ± SE values (n = 6) of peak amplitude, and slopes of the 1st and 2nd segments of evoked slow waves during early and late sleep. Waves in early and late sleep are matched by their amplitude (*, P < 0.05, paired t-test).
FIG. 6.
FIG. 6.
Peristimulus background activity has an influence on the amplitude of evoked slow waves. A: triggered single-trial responses in the left frontal derivation after the right frontal derivation was stimulated (200 trials from one representative rat) sorted as a function of the latency to the preceding spontaneous high-amplitude slow wave (> mean +1 SD). Voltage is color-coded (red, positive; blue, negative). Note that the proximity of the preceding spontaneous slow wave to the trigger resulted in a failure of the electrical pulse to trigger slow waves in ∼40 cases. B: typical individual traces depicting slow waves triggered on the background of low-amplitude activity (top trace) and triggered immediately after spontaneous slow wave (bottom trace) from 1 representative animal. Positivity - upward. Vertical bar denotes the timing of the trigger. C and D: mean amplitude of spontaneous slow waves, preceding the trigger, and their latency prior to the trigger, were computed separately for those cases where full-fledged high-amplitude evoked slow waves was induced, and for those cases where the induction was not successful. Specifically, for this analysis all individual trials were sorted based on the maximal value of the signal within the 1st 250 ms after the trigger. Subsequently, the mean amplitude and the latency of the closest immediately preceding spontaneous slow wave were computed for the top and bottom 100 trials, corresponding to the “biggest” and “smallest” 100 evoked slow waves (mean ± SE, n = 6; *, P < 0.05, paired t-test).
FIG. 7.
FIG. 7.
Time course of evoked and spontaneous slow waves and SWA within NREM sleep episodes (only episodes lasting >3min are included). Each individual episode is subdivided into 6 percentiles of equal duration. A: time course of the incidence of spontaneous high-amplitude slow waves, defined as waves > mean +SD and represented as percentage of mean incidence within the corresponding NREM episode (means ± SE, n = 14 rats). B: SWA for each percentile represented as percentage of the mean SWA for the entire NREM sleep episode (mean values ± SE, n = 14). C: mean amplitude of evoked slow waves within each percentile, represented as percentage of the mean amplitude of all evoked slow waves within the corresponding NREM sleep episode (mean ± SE, n = 6). D: mean maximal amplitude of evoked slow waves encountered within each percentile of NREM sleep episodes represented as percentage of the mean between all percentiles of the corresponding episode (mean ± SE, n = 6). Triangles indicate significant differences from the first percentile (P < 0.05, Dunn-Sidak test).
FIG. 8.
FIG. 8.
A: cumulative probability of the occurrence of a high-amplitude spontaneous sleep slow wave (> mean + SD) recorded in the frontal derivation plotted as a function of the time lag starting from the peak of the preceding spontaneous sleep slow wave (500 slow waves were included in this analysis for each of the two conditions: early sleep (hours 1–2 of the light period), late sleep (hours 7–8 of the light period)). The probability is computed as a proportion of trials where ≥1 slow wave was detected within a given time lag. Note that in no case a slow wave was initiated within the 1st 200 ms from the preceding peak. 100% probability was observed with time lags of ∼1.5 and 2 s for early sleep and late sleep, respectively (means ± SE, n = 14). Triangles indicate significant differences between early sleep and late sleep (P < 0.05, paired t-test). B: schematic depiction of a typical slow wave and the time window (gray box) when evoked or spontaneous slow waves cannot occur.

References

    1. Abdeen MA, Stuchly MA. Modeling of magnetic field stimulation of bent neurons. IEEE Trans Biomed Eng 41: 1092–1095, 1994. - PubMed
    1. Achermann P, Borbely AA. Low-frequency (< 1 Hz) oscillations in the human sleep electroencephalogram. Neuroscience 81: 213–222, 1997. - PubMed
    1. Amzica F, Steriade M. Disconnection of intracortical synaptic linkages disrupts synchronization of a slow oscillation. J Neurosci 15: 4658–4677, 1995. - PMC - PubMed
    1. Amzica F, Steriade M. Electrophysiological correlates of sleep delta waves. Electroencephalogr Clin Neurophysiol 107: 69–83, 1998. - PubMed
    1. Bergmann BM, Mistlberger RE, Rechtschaffen A. Period-amplitude analysis of rat electroencephalogram: stage and diurnal variations and effects of suprachiasmatic nuclei lesions. Sleep 10: 523–536, 1987. - PubMed

Publication types

LinkOut - more resources