. 2009 May;8(5):971-85.
doi: 10.1074/mcp.M800252-MCP200. Epub 2009 Jan 21.

Grade-dependent proteomics characterization of kidney cancer

Affiliations

Grade-dependent proteomics characterization of kidney cancer

Bertrand Perroud et al. Mol Cell Proteomics. 2009 May.

Abstract

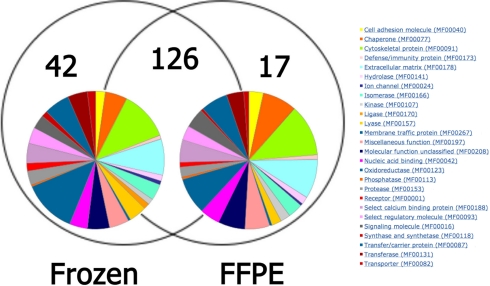
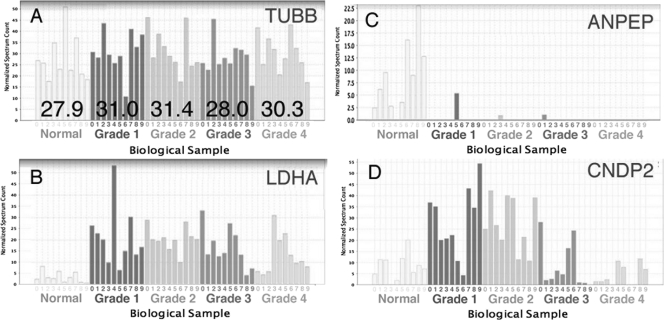
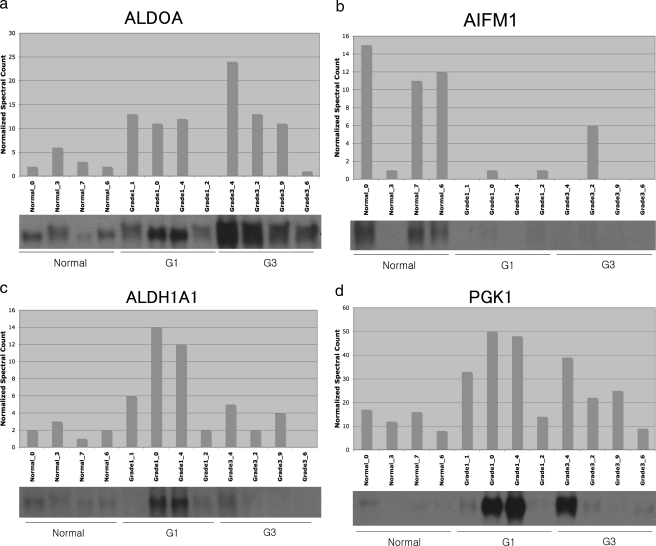
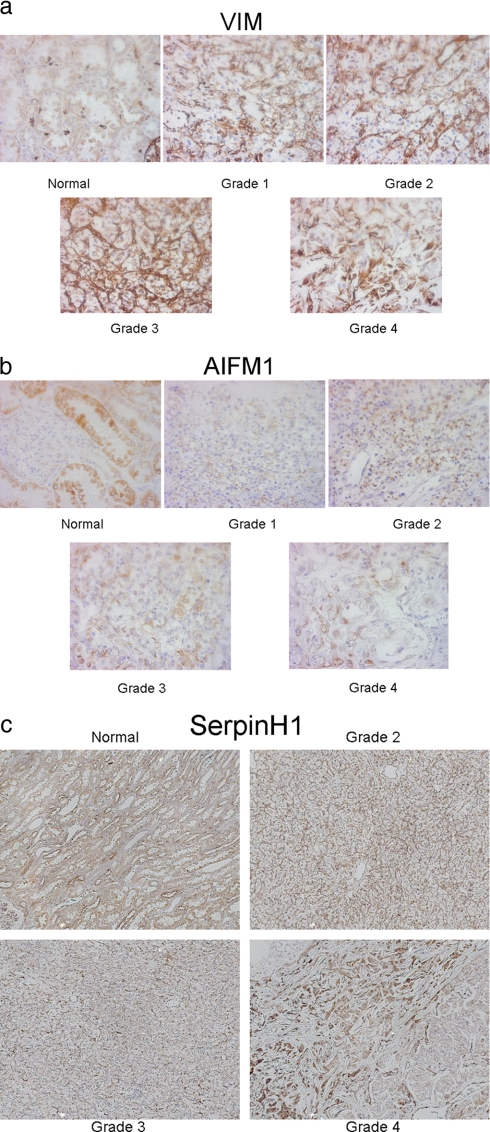
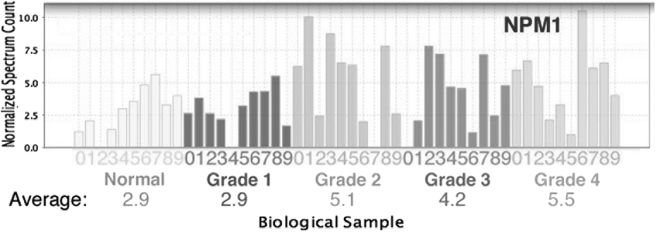
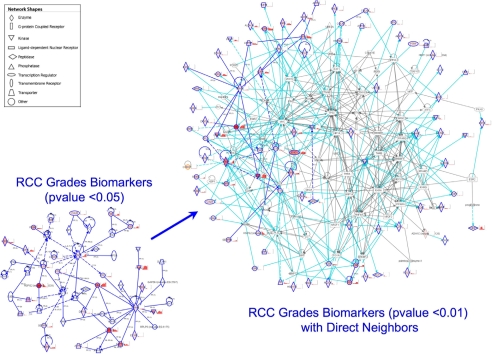
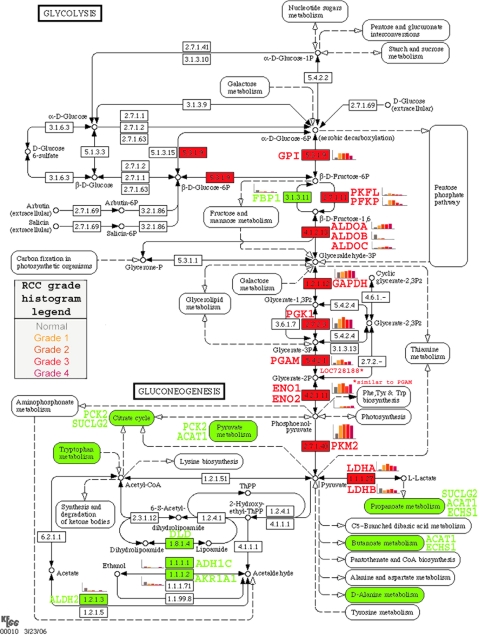
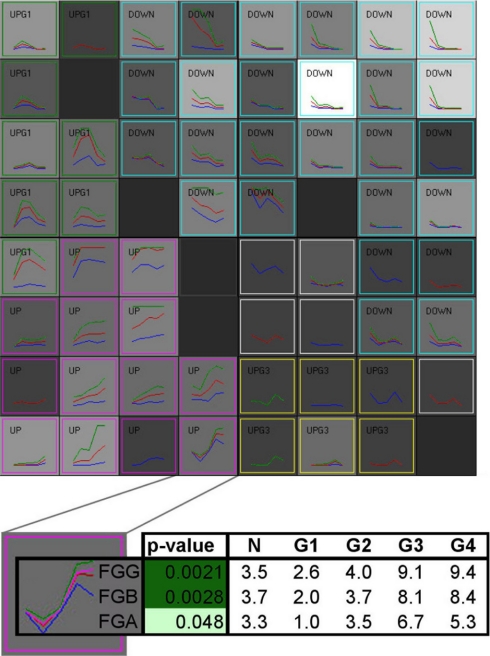
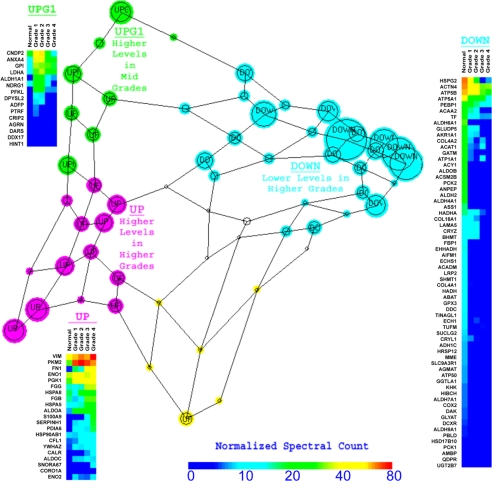
Kidney cancer is frequently metastatic on presentation at which point the disease is associated with a 95% mortality. Assessment of tumor grade on pathological examination is the most powerful means for prognostication as well as for stratification of patients into those who might respond to conventional or targeted therapy. Although there exist several grading systems in common use, all suffer from significant disparity among observers. In an attempt to objectify this process as well as to acquire grade-specific mechanistic information, we performed LC-MS/MS-based proteomics analysis on 50 clear cell kidney cancers equally distributed among normal tissues and Fuhrman grades 1-4. Initial experiments confirmed the utility of using archived formalin-fixed paraffin-embedded samples for LC-MS/MS-based proteomics analysis, and the LC-MS/MS findings were validated by extensive immunoblotting. We now show that changes among many biochemical processes and pathways are strongly grade-dependent with the glycolytic and amino acid synthetic pathways highly represented. In addition, proteins relating to acute phase and xenobiotic metabolism signaling are highly represented. Self-organized mapping of proteins with similar patterns of expression led to the creation of a heat map that will be useful in grade characterization as well as in future research relating to oncogenic mechanisms and targeted therapies for kidney cancer.


Figures

F<sc>ig</sc>. 1.
Fig. 1.
Comparison of proteomics analysis from frozen and FFPE tissues. Proteins identified by a minimum of two peptides (95% confidence) per sample in either class (n = 3 samples per class) are shown by Venn diagram. The complete list of these proteins is in supplemental Table 1. The colored circles represent pie charts of Panther molecular functions constructed from proteins identified in each sample source.
F<sc>ig</sc>. 2.
Fig. 2.
Sample variability for four representative proteins across grades. A, TUBB (ANOVA p value = 0.83), a representative of the four proteins with the lowest intra- and intergrade variability that were used as endogenous controls, is shown. The average value per grade is shown overlaid. A normalization factor was computed using the four endogenous controls and was used when comparing protein levels among grades. BD, normalized spectrum count is shown for three representative proteins that have varying protein level grade patterns. B, aminopeptidase N (ANPEP); C, LDHA; D, CNDP2.
F<sc>ig</sc>. 3.
Fig. 3.
Validation of proteomics MS analysis by immunoblotting. Protein was extracted from tissue samples homologous to that used for LC-MS analysis and was subjected to immunoblotting using the antibodies described under “Experimental Procedures.” For each protein, the upper section shows the normalized spectral count, and the lower section shows the corresponding sample immunoblot. a, ALDOA; b, AIFM1 (apoptosis-inducing factor 1, mitochondrial precursor); c, ALDH1A1 (aldehyde dehydrogenase family 1 member A1; retinal dehydrogenase 1); d, PGK1. G, grade.
F<sc>ig</sc>. 4.
Fig. 4.
Immunohistochemistry of representative tissue across cancer grades. Representative proteins displaying different grade-specific patterns of expression are shown analyzed by immunohistochemistry of VIM (20×) (a), AIFM1, apoptosis-inducing factor 1, mitochondrial (10×) (b), and SERPINH1, Serpin H1 precursor, HSP47, collagen-binding protein (10×) (c).
F<sc>ig</sc>. 5.
Fig. 5.
Levels of nucleophosmin are significantly increased in grades 2–4. Normalized spectrum count for the nucleolar protein nucleophosmin is analyzed by pairwise test of statistical significance (Student's t test p value = 0.0025 for normal and grade 1 versus grades 2, 3, and 4).
F<sc>ig</sc>. 6.
Fig. 6.
Network analysis of proteins showing significant grade-specific changes. Proteins showing significant grade-specific changes (p < 0.05) are assembled into a network showing direct (solid line) and indirect (dashed line) interactions (left) shown in dark blue. Colored proteins (red hues) are part of the 105 significantly grade-dependent (p < 0.01) proteins and have accompanying grade-specific histograms (normal to grade 4 from left to right). The network was grown (right) to include direct first-order neighbors of the significant proteins (p < 0.01). Connections between a member of the 105 significantly (p < 0.01) grade-dependent proteins and a direct first-order neighbor are shown in cyan. Connections between direct first-order neighbors are shown in gray.
F<sc>ig</sc>. 7.
Fig. 7.
The glycolysis pathway is altered in a grade-specific manner. As representative of grade-specific proteomics data, elements of the glycolysis pathway are shown as a function of tumor grade. Colors indicate significantly (p < 0.05) higher (red) or lower (green) in RCC versus normal. Histograms of grade-specific changes are shown adjacent to significantly altered proteins. PGAM, phosphoglycerate mutase; GPI, glucose-phosphate isomerase; GAPDH, glyceraldehyde-3-phosphate dehydrogenase; P, phosphate.
F<sc>ig</sc>. 8.
Fig. 8.
Cluster analysis of proteins showing significant grade-specific changes. 181 proteins with an RCC grade ANOVA p value <0.05 were clustered using a 64-node SOM algorithm on the basis of the similarity between protein levels across grades. The density of each node is shown by the gray intensity (black = 0; white = 10). In each node, minimum (blue), maximum (green), and average (red) across normal kidney tissue and four RCC grade are plotted. The nodes were then grouped based on their trend: up, pink; down, cyan; UpG1, highest level in grade 1 or 2, green; UpG3, highest level in grade 3, yellow). The bottom panel shows a typical cluster magnified. It is made of three proteins: the three chains (α, β, and γ) of fibrinogen, the precursor of fibrin. The table shows the underlying spectral count data for these three protein chains. G, grade.
F<sc>ig</sc>. 9.
Fig. 9.
Sammon map of grade-specific protein SOM clusters. Using the patterns of levels of the proteins that were significantly different among grades, the SOM nodes shown in Fig. 8 were plotted into a Sammon map. Each node is represented by a circle with a size proportional to the density of the cluster node. The distance and relative position of each node represent the relative similitude of the protein level pattern across grade between cluster nodes. For each group of cluster nodes (up, pink; down, cyan; UpG1, highest level in grade 1 or 2, green) a heat map of the normalized spectral count in normal tissue and in the four RCC grades is plotted.

References

    1. Weiss, R. H., and Lin, P.-Y. ( 2006) Kidney cancer: identification of novel targets for therapy. Kidney Int. 69, 224–232 - PubMed
    1. Novara, G., Martignoni, G., Artibani, W., and Ficarra, V. ( 2007) Grading systems in renal cell carcinoma. J. Urol. 177, 430–436 - PubMed
    1. Fuhrman, S. A., Lasky, L. C., and Limas, C. ( 1982) Prognostic significance of morphologic parameters in renal cell carcinoma. Am. J. Surg. Pathol. 6, 655–663 - PubMed
    1. Hwang, S. I., Thumar, J., Lundgren, D. H., Rezaul, K., Mayya, V., Wu, L., Eng, J., Wright, M. E., and Han, D. K. ( 2007) Direct cancer tissue proteomics: a method to identify candidate cancer biomarkers from formalin-fixed paraffin-embedded archival tissues. Oncogene 26, 65–76 - PubMed
    1. Wessel, D., and Flugge, U. I. ( 1984) A method for the quantitative recovery of protein in dilute solution in the presence of detergents and lipids. Anal. Biochem. 138, 141–143 - PubMed

Publication types