. 2009 Apr;23(4):475-85.
doi: 10.1210/me.2008-0284. Epub 2009 Jan 22.

Insulin regulates TRB3 and other stress-responsive gene expression through induction of C/EBPbeta

Affiliations

Insulin regulates TRB3 and other stress-responsive gene expression through induction of C/EBPbeta

Keyong Du et al. Mol Endocrinol. 2009 Apr.

Abstract

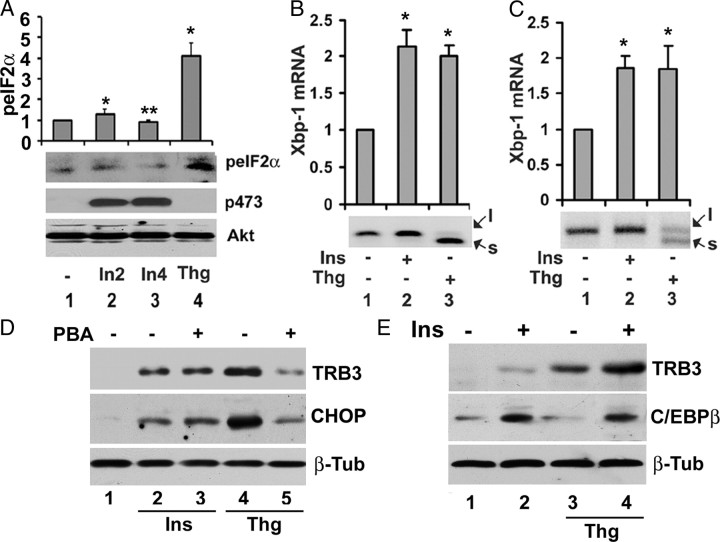
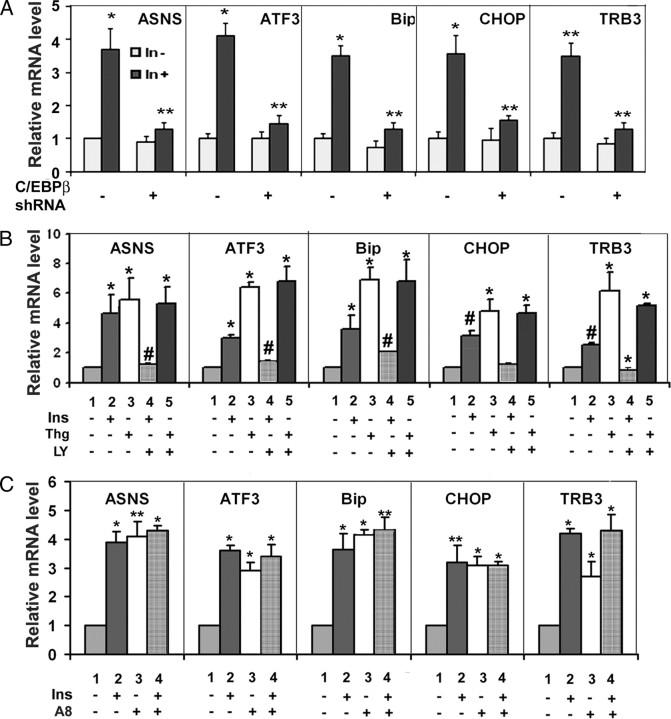
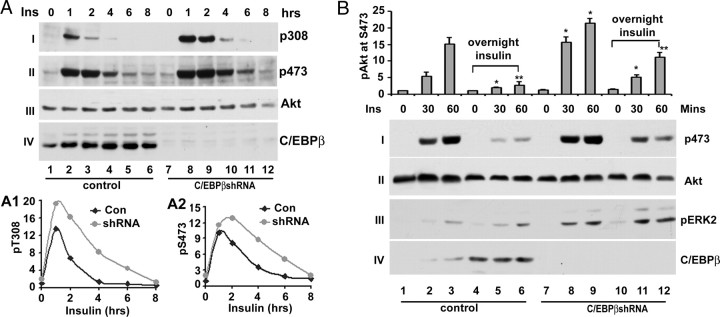
Pseudokinase TRB3 is an inducible gene whose expression is regulated by stress response and insulin and associated with insulin resistance and metabolic syndrome. In this report, we have investigated the mechanism under which insulin regulates TRB3 gene expression and demonstrated that insulin induces TRB3 expression via C/EBPbeta. We found that in Fao hepatoma and 3T3-L1 adipocytes, C/EBPbeta expression induced by insulin preceded that of TRB3 and that mutation of the C/EBPbeta binding site in TRB3 promoter abolished the responsiveness of the TRB3 gene to insulin. We further showed that ectopic expression of C/EBPbeta augmented, whereas knockdown of C/EBPbeta reduced, TRB3 expression induced by insulin. In addition, we presented data to show that insulin, through a similar mechanism under which insulin induces TRB3 expression, promotes the expression of genes such as ANAS, ATF3, BIP, and CHOP, which are typical stress-responsive genes. We also examined the impact of C/EBPbeta expression on Akt activation and found that inaction of C/EBPbeta not only augmented Akt activation but also obliterated the suppression of Akt activation due to prolonged insulin stimulation. We suggest, through induction of C/EBPbeta in hepatic cells and adipocytes, that insulin induces the expression of stress-responsive genes, which may represent a novel insulin action.


Figures

Fig. 1.
Fig. 1.
A and B, Induction of the expression of C/EBPβ and TRB3 in Fao (A) and 3T3-L1 adipocytes (B) by insulin. Overnight serum-starved Fao cells (and 3T3-L1 adipocytes) were treated with 100 nm insulin at indicated times. Total cell lysates were then prepared for Western blot analysis with anti-TRB3 (I), anti-C/EBPβ (II), anti-ATF4 (III), and anti-β-tubulin (IV) antibodies respectively. C, Impact of PI3K inhibitor LY294002 and Akt inhibitor VIII on the expression of C/EBPβ and TRB3 in Fao cells. Fao cells were pretreated with either dimethylsulfoxide (vehicle, Veh), or 2.5 μm Akt inhibitor VIII (A8) or LY294002 (LY) followed by 6 h insulin (100 nm) treatment. Total cell lysates were then prepared for Western blot with anti-TRB3 (panel I), anti C/EBPβ (panel II), anti-phospho-Akt at Ser473 (panel III), and anti-Akt (panel IV) antibodies, respectively. In each figure, the right panel represented the quantitative presentation of the left panel, in which the expression of each protein at time zero was set as 1 after normalization to the amount of β-tubulin in each lane. All of these experiments were repeated at least three times with similar results. Only representative data are shown.
Fig. 2.
Fig. 2.
A, Schematic presentation of TRB3 promoter TATA box, the CCAAT enhancer, and AARE are indicated. Numbers represent the position of each cis-acting element. Lowercase letters represent the mutated nucleotide in each cis-acting element. B, The impact of CCAAT enhancer and AARE on the responsiveness of TRB3 to insulin. HepG2 cells were transfected with TRB3 promoter luciferase reporter constructs indicated in A. At 24 h after transfection, the transfected cells were serum starved overnight. After 8 h insulin (100 nm) treatment, the total cell lysates were extracted for measuring luciferase activity. The experiments were carried out as triplicate and repeated twice. The final luciferase activity was normalized to β-galactosidase activity cotransfected with reporter plasmids. The error bars represent sd from three experiments. *, P < 0.04, Student’s t test; **, P < 0.05. C, The same as B except the TRB3 promoter activity was presented as fold changes in which the activity of each TRB3 promoter construct was set as 1 under the basal (no insulin treatment) condition. *, P < 0.021, Student’s t test; **, P < 0.012.
Fig. 3.
Fig. 3.
Impact of C/EBPβ expression on TRB3 gene expression A, Ectopic expression of C/EBPβ augments TRB3 expression. Fao cells were transduced with either GFP- or C/EBPβ-expressing pMIGR1 retrovirus, and 48 h later, the cells were treated with insulin at indicated time points and total cell lysates were prepared for Western blot with anti-TRB3 (top), anti-C/EBPβ (middle), and anti-β-tubulin (bottom) antibodies, respectively. B, Transient transfection and luciferase assay to show that C/EBPβ activates TRB3 promoters in HepG2 cells. The experiments were carried out in triplicate and repeated twice. The final luciferase activity was normalized to β-galactosidase activity cotransfected with reporter and effector plasmids. The error bars represent sd from three experiments. *, P < 0.003, Student’s t test; **, P < 0.011. C, Knockdown of C/EBPβ inhibits TRB3 expression induced by insulin Fao cells expressing either control (scrambled) or C/EBPβ shRNA via adenoviral transfer were treated with insulin at indicated times, and total cell lysates were prepared for Western blot with anti-TRB3 (top), anti-C/EBPβ (middle), and anti-β-tubulin (bottom) antibodies, respectively. D, ChIP assay to show that C/EBPβ binds TRB3 promoter Fao cells expressing control (scrambled) or C/EBPβ shRNA were treated with insulin, and ChIP assays were carried out as described in Materials and Methods. E, Transient transfection and luciferase assay to show that C/EBPβ shRNA suppresses TRB3 promoters in HepG2 cells. The experiments were carried out in triplicate and repeated twice. The final luciferase activity was normalized to β-galactosidase activity cotransfected with reporter and effector plasmids. The error bars represent sd from three experiments. *, P < 0.012; **, P < 0.021.
Fig. 4.
Fig. 4.
Insulin promotes the expression of stress-responsive genes. A, Real-time RT-PCR analysis of total RNA from Fao cells were treated with either 100 nm insulin (Ins) or 2 μm thapsigargin (Thg) or dimethylsulfoxide (−) for 4 h with specific primers to ASNS, BIP (also known as GRP78 for glucose-responsive protein 78 kDa), CHOP, and TRB3. Total RNAs were prepared for real-time RT-PCR analysis as described in Materials and Methods. B and C, 3T3-L1 adipocytes (B) and 3T3-L1 preadipocytes (C) were treated with either insulin (Ins) or thapsigargin (Thg) or dimethylsulfoxide (−) for 4 h. Total RNAs were then prepared for RT-PCR with specific primers to indicated genes. In all cases, the level of 36B4 served as control, and the level of each mRNA was set as 1 after normalization to the level of 36B4. Each bar represents the mean ± sd (n = 3). *, P < 0.015; **, P < 0.021.
Fig. 5.
Fig. 5.
Insulin does not provoke ER stress response. A, Insulin does not promote phosphorylation of eIF2α at Ser51. Serum-starved Fao cells were treated with either 100 nm insulin for 2 and 4 h (In2 and In4) or 2 μm thapsigargin for 4 h, and total cell lysates were prepared for Western blot with anti-phospho-eIF2a at Ser51, anti-phospho-Akt at Ser473, and anti-Akt antibodies, respectively; top, quantification of eIF2α phosphorylation at Ser 52 in which the level of eIF2α phosphorylation from untreated cells was set as one after normalization to the level of Akt. Each bar represents the mean ± sd (n = 3). *, P < 0.026; **, P < 0.05. B and C, In Fao cells (B) and 3T3-L1 adipocytes (C), insulin does not promote Xbp-1 splicing. Fao cells (or 3T3-L1 adipocytes) were treated with either 100 nm insulin or 2 μm thapsigargin for 4 h, and total RNA was prepared for RT-PCR analysis with specific primers for Xbp-1; top, quantification level of Xpb-1 mRNA (note that the level of Xbp-1 under thapsigargin treatment contains both forms of Xbp-1). Each bar represents the mean ± sd (n = 3). *, P < 0.016. D, Chemical chaperone has no impact on insulin-induced TRB3 and CHOP expression. Fao cells were pretreated with or without 10 mm 4-PBA for 12 h followed by insulin for 6 h. Total cell lysates were then prepared for Western blot with anti-TRB3 (top) anti-CHOP (middle), and β-tubulin (bottom) antibodies, respectively. E, Additive effects of insulin and ER stress on TRB3 and C/EBPβ expression. Fao cells were treated with 100 nm insulin, 2 μm thapsigargin, and insulin plus thapsigargin, respectively. Total cell lysates were prepared after 6 h treatment for Western blot analysis with anti-TRB3 (top), anti-C/EBPβ (middle), and anti-β-tubulin (bottom) antibodies, respectively.
Fig. 6.
Fig. 6.
Role of C/EBPβ in insulin-promoted expression of stress-responsive genes. A, C/EBPβ-dependent induction of stress-responsive gene expression by insulin control (scrambled) or C/EBPβ shRNA-expressing Fao cells treated with or without 100 nm insulin for 4 h. Total RNAs were prepared for real-time RT-PCR analysis with the level of 36B4 serving as control. For each gene, the level of untreated cells was set as 1 after normalization to 36B4. Each bar represents the mean ± sd (n = 3). *, P < 0.016; **, P < 0.009. B, PI3K-dependent induction of the expression of stress-responsive genes by insulin. Fao cells were pretreated with or without 10 μm PI3K inhibitors LY294002 (LY) for 45 min followed by 4 h 100 nm insulin (Ins) or 2 μm thapsigargin (Thg) treatment. Total RNAs were prepared for real-time RT-PCR analysis. C, Negative role of Akt in the expression of stress-responsive genes by insulin. Fao cells were pretreated with or without 2.5 μm Akt inhibitor VIII (A8) for 45 min followed by 4 h 100 nm insulin (Ins). Total RNAs were prepared for real-time RT-PCR analysis. In all cases, the level of 36B4 serves as control, and the level of each mRNA was set as 1 after normalization to the level of 36B4. Each bar represents the mean ± sd (n = 3). *, P < 0.019; **, P < 0.015.
Fig. 7.
Fig. 7.
The impact of C/EBPβ expression on Akt activation induced by insulin. A, Knockdown of C/EBPβ augments Akt activation in Fao cells. Control (scrambled) or C/EBPβ-expressing Fao cells were treated with 100 nm insulin for indicated periods. The total cell lysates were prepared for Western blot with anti-phospho-Akt at Thr308 (I) and at Ser473 (II), anti-Akt (III), and anti-C/EBPβ (IV) antibodies, respectively. These experiments were repeated three times with similar results. A1 and A2, Quantitative analysis of Akt phosphorylation at Thr308 and Ser473, respectively. In these analyses, the level of Akt phosphorylation after normalization to total cellular level of Akt is set as 1. B, Knockdown of C/EBPβ obliterates suppression of Akt activation by prolonged insulin stimulation. Control (scrambled) or C/EBPβ-expressing Fao cells were pretreated with 100 nm insulin for overnight followed by further insulin stimulation for the indicated times. The total cell lysates were prepared for Western blot analysis with anti-phospho-Akt at Ser473 (I), anti-Akt (II), anti-pERK2 (III), and anti-C/EBPβ (IV) antibodies, respectively. Top, Quantitative analysis of phosphorylation of Akt at Ser473. In these analyses, the level of Akt phosphorylation after normalization to the total cellular level of Akt is set as 1. Each bar represents the mean ± sd (n = 3). *, P < 0.023; **, P < 0.016.

Similar articles

Cited by

References

    1. Hegedus Z, Czibula A, Kiss-Toth E2007. Tribbles: a family of kinase-like proteins with potent signalling regulatory function. Cell Signal 19:238–250 - PubMed
    1. Boudeau J, Miranda-Saavedra D, Barton GJ, Alessi DR2006. Emerging roles of pseudokinases. Trends Cell Biol 16:443–452 - PubMed
    1. Mata J, Curado S, Ephrussi A, Rorth P2000. Tribbles coordinates mitosis and morphogenesis in Drosophila by regulating string/CDC25 proteolysis. Cell 101:511–522 - PubMed
    1. Rorth P, Szabo K, Texido G2000. The level of C/EBP protein is critical for cell migration during Drosophila oogenesis and is tightly controlled by regulated degradation. Mol Cell 6:23–30 - PubMed
    1. Du K, Herzig S, Kulkarni RN, Montminy M2003. TRB3: a tribbles homolog that inhibits Akt/PKB activation by insulin in liver. Science 300:1574–1577 - PubMed

MeSH terms