. 2009 Jan 27;106(4):1145-50.
doi: 10.1073/pnas.0812551106. Epub 2009 Jan 21.

A network biology approach to aging in yeast

Affiliations

A network biology approach to aging in yeast

David R Lorenz et al. Proc Natl Acad Sci U S A. .

Abstract

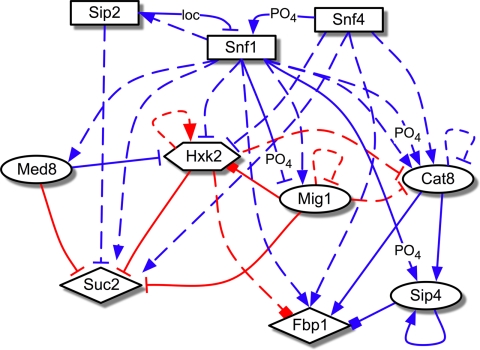
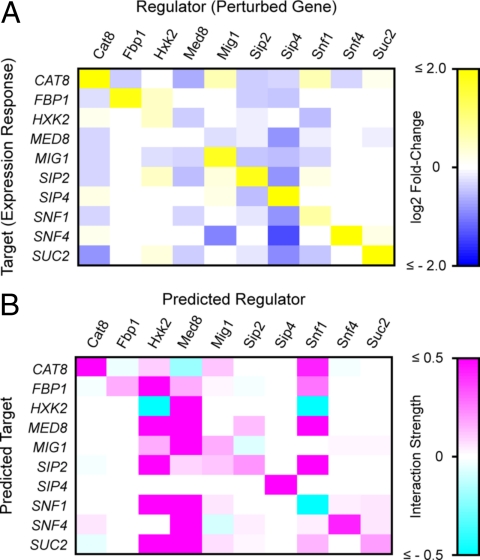
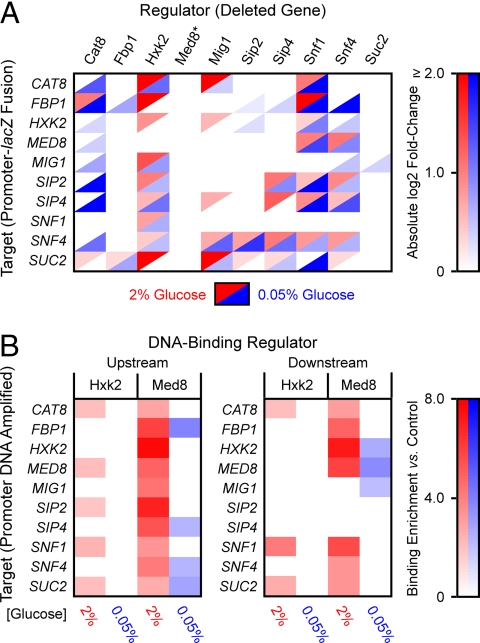
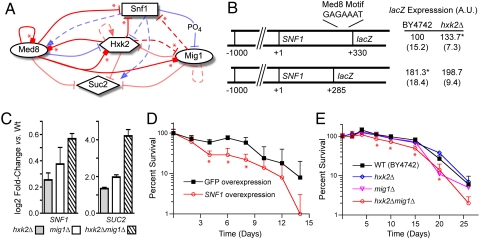
In this study, a reverse-engineering strategy was used to infer and analyze the structure and function of an aging and glucose repressed gene regulatory network in the budding yeast Saccharomyces cerevisiae. The method uses transcriptional perturbations to model the functional interactions between genes as a system of first-order ordinary differential equations. The resulting network model correctly identified the known interactions of key regulators in a 10-gene network from the Snf1 signaling pathway, which is required for expression of glucose-repressed genes upon calorie restriction. The majority of interactions predicted by the network model were confirmed using promoter-reporter gene fusions in gene-deletion mutants and chromatin immunoprecipitation experiments, revealing a more complex network architecture than previously appreciated. The reverse-engineered network model also predicted an unexpected role for transcriptional regulation of the SNF1 gene by hexose kinase enzyme/transcriptional repressor Hxk2, Mediator subunit Med8, and transcriptional repressor Mig1. These interactions were validated experimentally and used to design new experiments demonstrating Snf1 and its transcriptional regulators Hxk2 and Mig1 as modulators of chronological lifespan. This work demonstrates the value of using network inference methods to identify and characterize the regulators of complex phenotypes, such as aging.


Conflict of interest statement

The authors declare no conflict of interest.

Figures

Fig. 1.
Fig. 1.
Known interactions in the Snf1 network. Diagram of transcriptional regulatory influences previously described in the literature (see Table S1) by regulator proteins (source of arrows) on the expression of target genes (arrowheads) in glucose repressing (2% glucose, red edges) vs. low glucose growth conditions (including nonfermentable carbon sources) (blue edges). Solid lines denote known physical TF binding to regulatory sequences of target genes; dashed lines denote functional interactions in which the target's expression is regulated through possible intermediaries. Arrows denote activation, bars denote repression, and boxes denote physical associations established but not completely characterized. Nontranscriptional regulatory interactions are included where relevant: “PO4” denotes phosphorylation and “loc” denotes regulation through subcellular localization. Shapes of nodes indicate known functional attributes of proteins: rectangle, kinase or kinase-associated protein; circle, TF; diamond, enzyme; hexagon, dual enzyme/TF.
Fig. 2.
Fig. 2.
(A) mRNA expression profiling of network genes in response to systematic perturbations. Color intensities represent the magnitude of mRNA expression changes for each gene (Rows) in response to 2- to 4-fold over-expression of each other network gene (Columns), relative to an isogenic control strain expressing GFP. Values are log2-transformed ratios measured by quantitative RT-PCR, normalized by internal standard genes ACT1 and RDN18–1. Only significant expression changes (greater than the propagated standard error) were used for network model inference and are displayed here. (B) NIR-predicted transcriptional interactions in the Snf1 gene network. This matrix is a quantitative model of predicted regulatory influences. Color intensities denote the relative strength of regulators (Column vectors) upon mRNA expression of predicted target genes (Row vectors).
Fig. 3.
Fig. 3.
(A) Experimental confirmation of NIR-predicted functional interactions. Color intensities represent the absolute magnitude of ß-gal activity in deletion strains (Columns) expressing lacZ target-promoter fusions (Rows) relative to the same construct in the isogenic wild-type strain (BY4742). The essential Med8 protein (asterisk) could not be tested with this method. For clarity of presentation, absolute values of statistically significant (P ≤ 0.05) expression ratios are displayed. (B) In vivo ChIP-qPCR experimental results for regulators Hxk2 and Med8. Upstream denotes detection of Hxk2 or Med8 binding (Columns) to promoter DNA for each network gene (Rows); downstream indicates binding detected within the target coding region. Color intensities represent the ratio of enrichment of target DNA captured by immunoprecipitated Hxk2 or Med8 relative to control (isogenic wild-type strain BY4742), determined by real-time qPCR. Only statistically significant (P ≤ 0.10) expression changes are displayed.
Fig. 4.
Fig. 4.
Characterization of SNF1 transcriptional regulation and its effects on chronological lifespan. (A) Schematic of hypothesis tested in subsequent experiments that SNF1 gene expression is repressed by Hxk2, Med8, and Mig1 in 2% glucose (red arrows), in a manner analogous to the previously detailed regulation of SUC2 (asterisks denote new interactions predicted by the network model and confirmed experimentally in this study). Definitions of other symbols are the same as in Fig 1. (B) A putative Med8 binding motif in the coding sequence of SNF1 represses expression of SNF1 promoter-lacZ fusions with Hxk2. Plasmids containing SNF1 promoters and variable lengths of the SNF1 coding region to include (SNF1+330) or exclude (SNF1+285), a sequence similar to the Med8 consensus motif fused in-frame to the lacZ reporter gene were transformed into hxk2Δ and isogenic wild-type strain BY4742. ß-gal activity was measured in SC media + 2% glucose. Values are normalized such that ß-gal activity in SNF1 + 330/BY4742 = 100, to compare data across multiple experiments. Asterisks indicate P < 0.05 relative to SNF1 + 330/BY4742. (C) Double deletion of HXK2 and MIG1 derepresses SNF1 expression synergistically. SNF1 and SUC2 (positive control) mRNA expression in hxk2Δ, mig1Δ, and hxk2Δmig1Δ deletion mutants relative to isogenic wild-type strain BY4742 was determined by qRT-PCR for cultures grown in SC media + 2% glucose. Error bars denote propagated standard error. (D and E) Effects of SNF1 expression on chronological longevity. Percent survival of poststationary phase cultures was determined from CFUs of batch cultures grown in SC media + 2% glucose. SNF1 and GFP overexpression strains (D) were the same as those used in perturbation experiments, constructed in the W303-derived strain BMA64–1A. Error bars denote standard deviation; data points with asterisks (*) signify statistically significant differences (P < 0.05) in CFUs relative to control at the same time point.

References

    1. Bishop NA, Guarente L. Genetic links between diet and lifespan: shared mechanisms from yeast to humans. Nat Rev Genet. 2007;8:835–844. - PubMed
    1. Kaeberlein M, Burtner C, Kennedy B. Recent developments in yeast aging. PLoS Genet. 2007;3:e84. - PMC - PubMed
    1. Fabrizio P, Longo VD. The chronological life span of Saccharomyces cerevisiae. Aging Cell. 2003;2:73–81. - PubMed
    1. Bitterman KJ, Medvedik O, Sinclair D. Longevity regulation in Saccharomyces cerevisiae: linking metabolism, genome stability, and heterochromatin. Microbiol Mol Biol Rev. 2003;67:376–399. - PMC - PubMed
    1. Lin SJ, Defossez PA, Guarente L. Requirement of NAD and SIR2 for life-span extension by calorie restriction in Saccharomyces cerevisiae. Science. 2000;289:2126–2128. - PubMed

Publication types

MeSH terms

Substances

LinkOut - more resources