. 2009 Feb 3;106(5):1578-83.
doi: 10.1073/pnas.0809533106. Epub 2009 Jan 21.

Polymicrobial interactions stimulate resistance to host innate immunity through metabolite perception

Affiliations

Polymicrobial interactions stimulate resistance to host innate immunity through metabolite perception

Matthew M Ramsey et al. Proc Natl Acad Sci U S A. .

Abstract

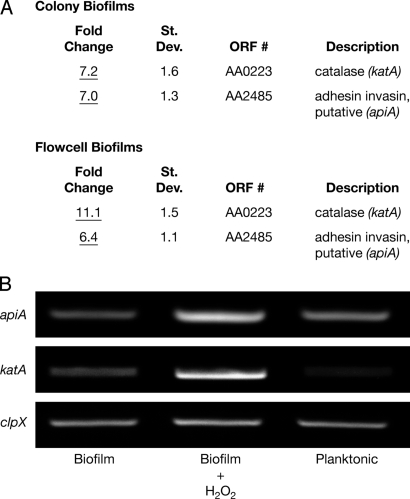
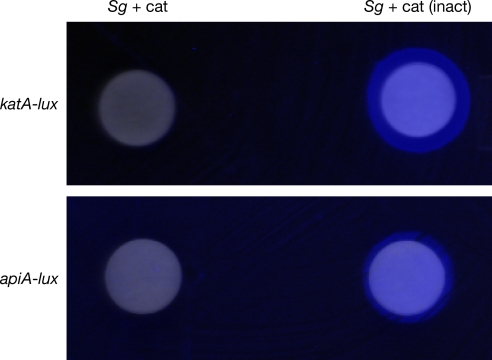
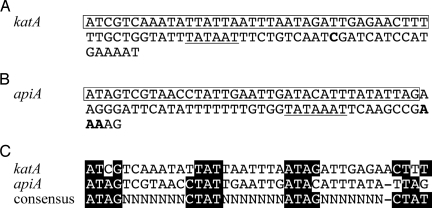
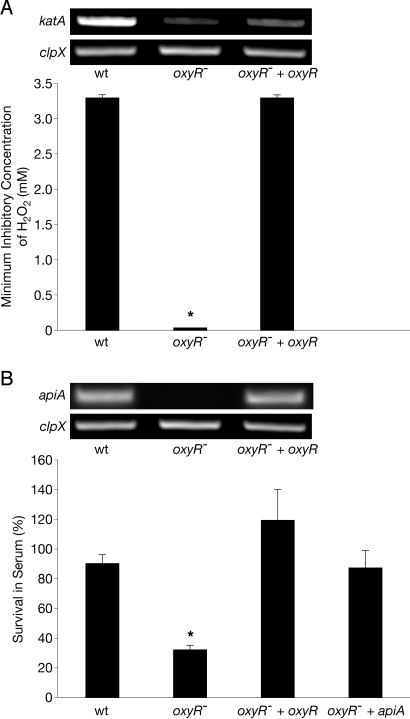
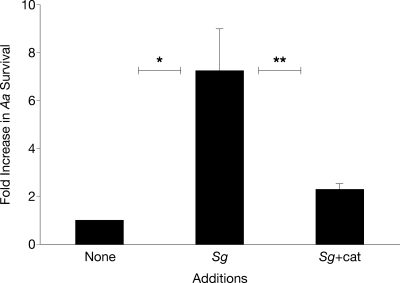
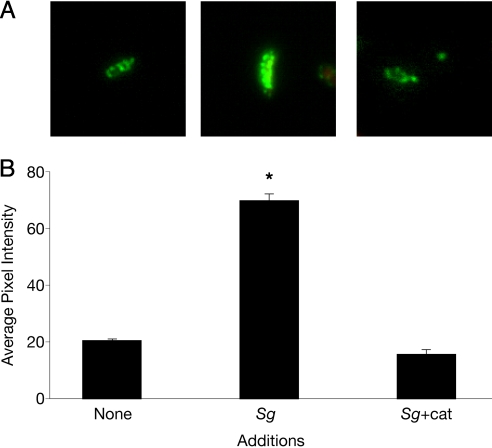
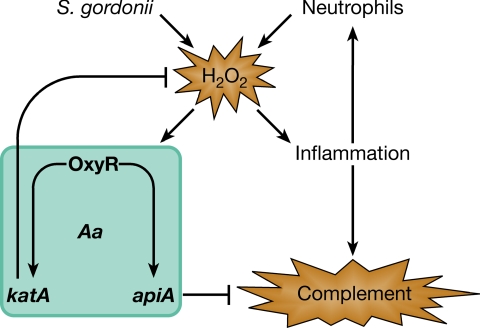
Bacteria in the human oral cavity often grow in an attached multispecies biofilm community. Members of this community display defined interactions that have an impact on the physiology of the individual and the group. Here, we show that during coculture growth with streptococci, the oral pathogen Aggregatibacter actinomycetemcomitans displays enhanced resistance to killing by host innate immunity. The mechanism of resistance involves sensing of the streptococcal metabolite hydrogen peroxide by A. actinomycetemcomitans, which stimulates a genetic program resulting in enhanced expression of the complement resistance protein ApiA. The oxidative stress response regulator OxyR mediates induction of apiA transcription, and this induction is required for coculture resistance to killing by human serum. These findings provide evidence that interaction between community members mediates prokaryotic resistance to host innate immunity and reinforce the need to understand how polymicrobial growth affects interaction with the host immune system.


Conflict of interest statement

The authors declare no conflict of interest.

Figures

Fig. 1.
Fig. 1.
A. actinomycetemcomitans katA and apiA are induced on H2O2 exposure. (A) A custom Affymetrix GeneChip was used to examine gene expression of A. actinomycetemcomitans colony and flow cell biofilms in the presence and absence of 1 mM exogenous H2O2. Fold changes were determined from 4 pairwise comparisons and determined to be statistically different for katA and apiA (P < 0.05) using GeneChip Operating Software version 1.4. (B) RT-PCR was used to verify katA and apiA induction in colony biofilms on following exposure to H2O2. The constitutively expressed gene clpX was used to standardize cDNA template levels, and planktonic-grown bacteria were used to assess the impact of enhanced aeration on basal transcript levels.
Fig. 2.
Fig. 2.
katA and apiA are induced during coculture with S. gordonii. A. actinomycetemcomitans containing the katA-luxCDABE or apiA-luxCDABE reporter fusion was spread on agar Petri plates and exposed to S. gordonii–soaked disks containing active catalase (Sg + cat) or heat-inactivated catalase (Sg). Light production was examined using a Syngene imaging system. The image is a composite of visible light and luminescence (blue) photographs. Sterile paper disks did not induce light production by either reporter fusion (not shown).
Fig. 3.
Fig. 3.
DNA sequences of the katA (base pairs 154293–154374) (A) and apiA (base pairs 1724157–1724078) (B) promoter regions. Transcription start sites are in boldface, putative −10 regions are underlined, and oxyR-like binding elements are boxed. (C) Alignment of the putative katA and apiA OxyR binding sequences with the consensus binding sequence (29, 30).
Fig. 4.
Fig. 4.
The A. actinomycetemcomitans oxyR mutant is hypersusceptible to killing by H2O2 and human serum. (A) The H2O2 minimum inhibitory concentration (lowest concentration necessary to inhibit visible growth of an organism) of WT A. actinomycetemcomitans (wt), the A. actinomycetemcomitans oxyR mutant (oxyR), and the genetically complemented A. actinomycetemcomitans oxyR mutant (oxyR + oxyR). (Inset) RT-PCR analysis of mRNA levels of katA and the clpX constitutively expressed control in the wt oxyR, and oxyR + oxyR after H2O2 exposure. (B) Survival of wt, oxyR, oxyR + oxyR, and oxyR constitutively expressing apiA (oxyR + apiA) in the presence of 50% (vol/vol) normal human serum. Percent survival was calculated as follows: number of cells recovered from normal human serum treatment/number of cells recovered from heat-inactivated serum treatment. (Inset) RT-PCR analysis of mRNA levels of apiA and the clpX constitutively expressed control in the wt, oxyR, and oxyR + oxyR after H2O2 exposure. As a control, exogenous catalase was added to serum to ensure that any phenotype observed was not attributable to endogenous H2O2 within serum. Error bars represent SEM. *P < 0.004 via Student's t test, n = 3.
Fig. 5.
Fig. 5.
Coculture with S. gordonii enhances A. actinomycetemcomitans resistance to killing by human serum. Fold increase in survival of A. actinomycetemcomitans on exposure to 50% (vol/vol) normal human serum when grown in monoculture (Aa), coculture with S. gordonii + heat-inactivated catalase (Aa+Sg), and coculture with S. gordonii + catalase (Aa+Sg+cat). Ratios were calculated as follows: colony-forming units present after serum treatment/colony-forming units present after heat-inactivated serum treatment. Error bars represent SEM. It is important to note that cell numbers were similar with and without catalase in the heat-inactivated complement cultures. *P < 0.01, **P < 0.05 via Student's t test, n = 3.
Fig. 6.
Fig. 6.
Factor H displays enhanced binding to A. actinomycetemcomitans during coculture with S. gordonii. (A) Immunofluorescent micrographs of factor H attachment to the surface of A. actinomycetemcomitans during monoculture (Aa), coculture with S. gordonii + heat-inactivated catalase (Aa+Sg), and coculture with S. gordonii + catalase (Aa+Sg+cat). Images were recorded at magnification ×1,000. (B) Average green channel fluorescence intensity per cell. Averages were calculated from 40 independent measurements. Error bars represent SEM. *P < 0.0001 via Student's t test.
Fig. 7.
Fig. 7.
Model for the role of H2O2 as a mediator of A. actinomycetemcomitans resistance to innate immunity. Enhanced levels of H2O2 produced by S. gordonii during plaque growth stimulate inflammation, leading to an influx of innate immune modulators, including complement and neutrophils. A. actinomycetemcomitans responds to rising H2O2 by induction of katA and apiA, which, in turn, enhance resistance to innate immune effectors. On recruitment to the site of inflammation, neutrophils increase the levels of H2O2 and further stimulate induction of katA and apiA.

Similar articles

Cited by

References

    1. Meyer DH, Fives-Taylor PM. Oral pathogens: from dental plaque to cardiac disease. Curr Opin Microbiol. 1998;1:88–95. - PubMed
    1. Ebersole JL, Cappelli D, Sandoval MN. Subgingival distribution of A. actinomycetemcomitans in periodontitis. J Clin Periodontol. 1994;21:65–75. - PubMed
    1. Courts FJ, Boackle RJ, Fudenberg HH, Silverman MS. Detection of functional complement components in gingival crevicular fluid from humans with periodontal diseases. J Dent Res. 1977;56:327–331. - PubMed
    1. Biswas S, Duperon DF, Chebib FS. Study of crevice fluid in relation to periodontal disease in children. II. Effect of age, sex and gingival inflammation on crevice fluid protein, carbohydrate, total calcium, phosphate and nitrogen. J Periodontal Res. 1977;12:265–278. - PubMed
    1. Ficara AJ, Levin MP, Grower MF, Kramer GD. A comparison of the glucose and protein content of gingival fluid from diabetics and nondiabetics. J Periodontal Res. 1975;10:171–175. - PubMed

Publication types