. 2009 Feb 18;28(4):417-28.
doi: 10.1038/emboj.2008.302. Epub 2009 Jan 22.

Matrix alkalinization: a novel mitochondrial signal for sustained pancreatic beta-cell activation

Affiliations

Matrix alkalinization: a novel mitochondrial signal for sustained pancreatic beta-cell activation

Andreas Wiederkehr et al. EMBO J. .

Abstract

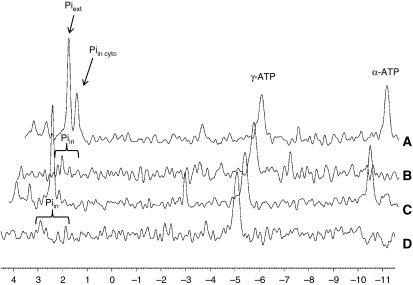
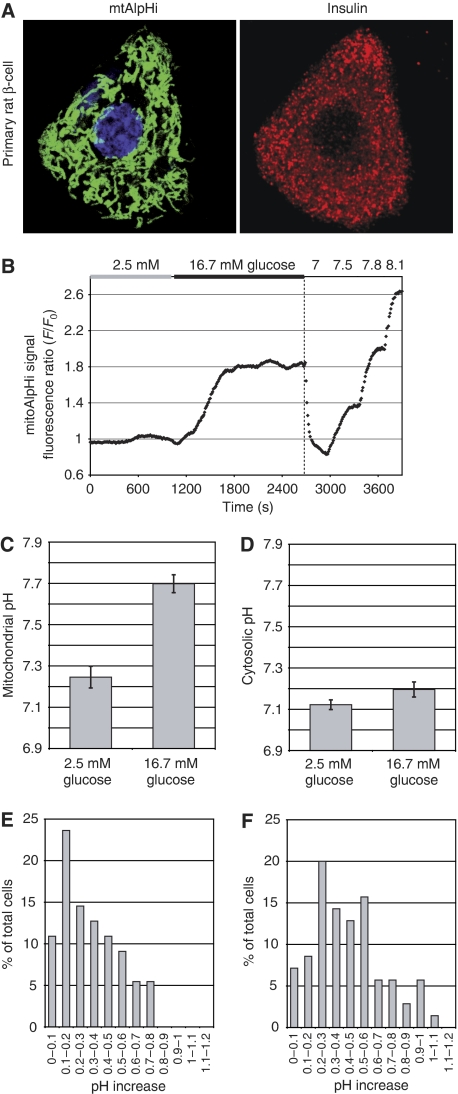
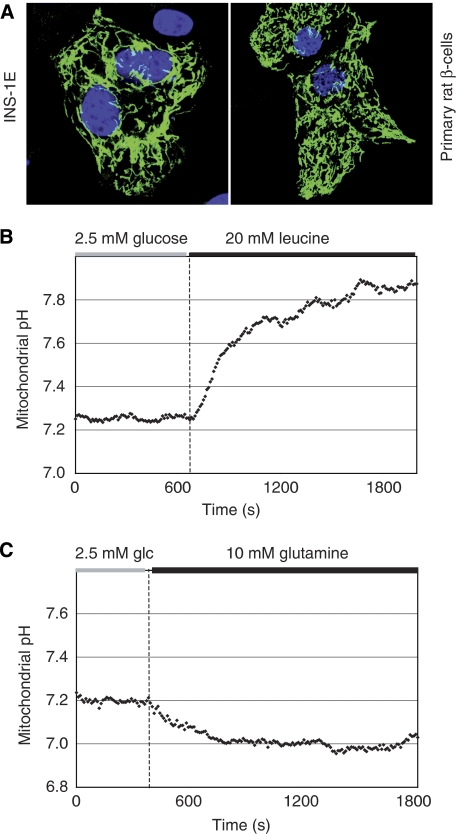
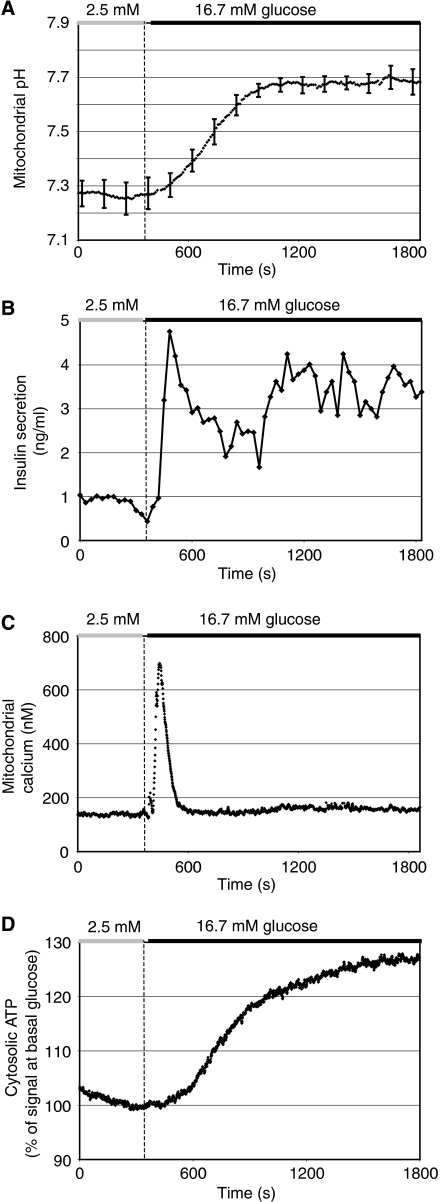
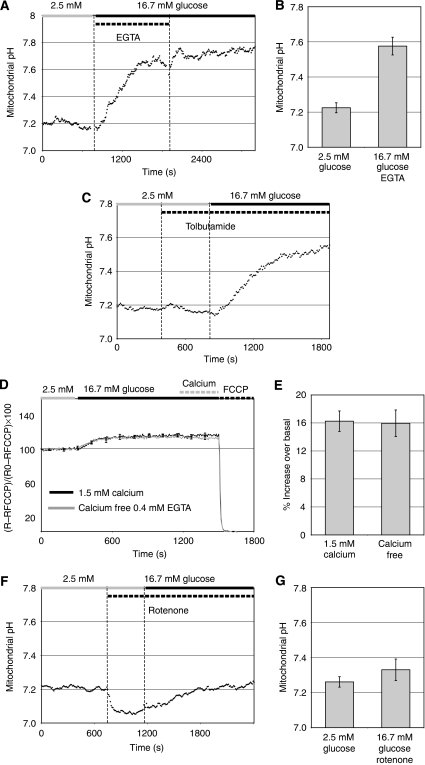
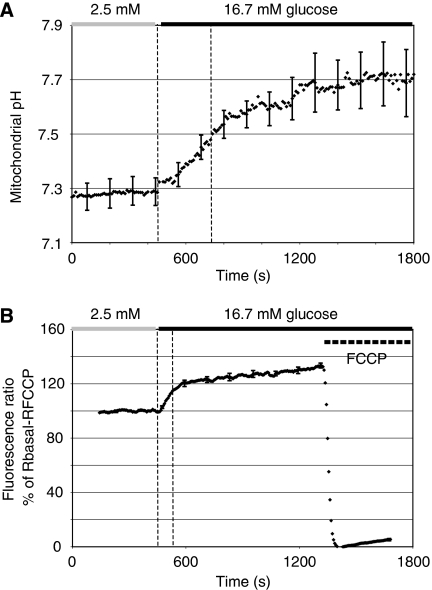
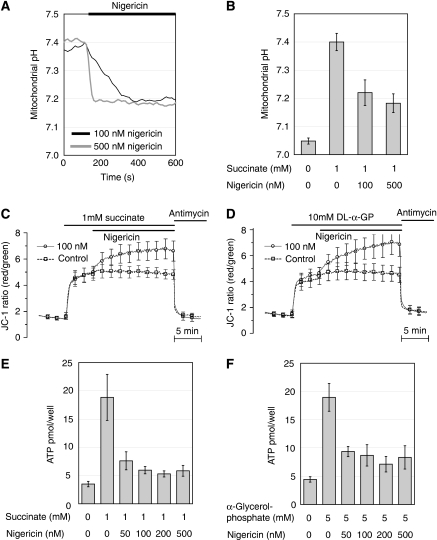
Nutrient secretagogues activate mitochondria of the pancreatic beta-cell through the provision of substrate, hyperpolarisation of the inner mitochondrial membrane and mitochondrial calcium rises. We report that mitochondrial matrix pH, a parameter not previously studied in the beta-cell, also exerts an important control function in mitochondrial metabolism. During nutrient stimulation matrix pH alkalinises, monitored by the mitochondrial targeted fluorescent pH-sensitive protein mtAlpHi or (31)P-NMR inorganic phosphate chemical shifts following saturation transfer. Compared with other cell types, the resting mitochondrial pH was surprisingly low, rising from pH 7.25 to 7.7 during nutrient stimulation of rat beta-cells. As cytosolic alkalinisation to the nutrient was of much smaller amplitude, the matrix alkalinisation was accompanied by a pronounced increase of the DeltapH across the inner mitochondrial membrane. Furthermore, matrix alkalinisation closely correlates with the cytosolic ATP net increase, which is also associated with elevated ATP synthesis rates in mitochondria. Preventing DeltapH increases in permeabilised cells abrogated substrate-driven ATP synthesis. We propose that the mitochondrial pH and DeltapH are key determinants of mitochondrial energy metabolism and metabolite transport important for cell activation.


Figures

Figure 1
Figure 1
31P-NMR spectra revealing different phosphate pools in INS-1 cells. Representative 31P-NMR spectra of alginate-entrapped INS-1 cells. The cells were perifused in oxygenated KRB buffer containing 2.5 mM glucose (A, B) or 15 mM glucose (C, D). The control spectra of the saturation transfer experiment, with the saturation pulse downfield of Pi at 2.5 mM glucose (A) and 15 mM glucose (C), show resonances corresponding to the extracellular Pi at 2.73 p.p.m. and intracellular Pi at 2.39 p.p.m. The difference between the two spectra of the saturation transfer experiment (saturation pulse at β-ATP or downfield of Pi) reveals metabolically active intracellular Pi pools, with their chemical shifts dependent on the pH of their respective intracellular location. For ease of comparison, difference spectra (B, D) are shown inverted. (In the difference spectra, the β-ATP peaks and Pi peaks have normally negative excursion. The α-ATP peak is not affected by the saturation of the β-ATP resonance and is subtracted out in the difference.)
Figure 2
Figure 2
Mitochondrial matrix alkalinisation in response to glucose in rat islets. Dissociated rat islet β-cells (A) or intact rat islets (B, C) were infected with an adenovirus carrying mtAlpHi under the control of the tetON promoter (Ad-tetON-mtAlpHi). Insulin immunofluorescence (A; right panel) was performed to identify β-cells expressing mtAlpHi (A; left panel). (B, C) Infected rat islets were incubated in 2.5 mM glucose and shifted to 16.7 mM glucose as indicated. For titrations of mtAlpHi fluorescence (B; see also Materials and methods), the intra-mitochondrial pH was clamped to pH values as indicated on top of the trace. (C) Average mitochondrial pH responses to glucose in rat islets (N=7). (D) Average pHcyto glucose responses in rat islets (N=9). The results are expressed as ±s.e.m. Cytosolic pH (D) was measured using the ratiometric fluorescent probe BCECF. (E, F) Histograms of single-cell analysis of matrix alkalinisation in INS-1E (E) and individual cells in intact rat islets (F). The increase of the pHmito was determined in single INS-1E (55 cells) and rat islets (70 cells from 10 islets). The cells were grouped according to the extent of alkalinisation in 0.1 pH unit increments and expressed as the percentage of total cells analysed.
Figure 3
Figure 3
Mitochondrial pH in INS-1E and HepG2 cells. INS-1E cells (AC) or HepG2 cells (D, E) expressing mtAlpHi were incubated in 2.5 mM glucose and shifted to 16.7 mM glucose as indicated. Average pHmito changes to glucose±s.e.m. in INS-1E cells (B; N=13) and HepG2 cells (E; N=4) are shown. (C) Average pHcyto changes to glucose±s.e.m. in INS-1E cells. Rotenone was used at a concentration of 2.5 μM.
Figure 4
Figure 4
β-Cell-specific expression of mtAlpHi for the measurement of mitochondrial pH responses to leucine and glutamine. INS-1E cells, dispersed islet cells (A) or intact rat islets (B, C) were infected with an adenovirus expressing mtAlpHi under the control of the rat insulin promoter (Ad-RIP-mtAlpHi). (A) Mitochondrial localisation of mtAlpHi was confirmed in INS-1E and primary rat β-cells. Mitochondrial matrix alkalinisation was induced by leucine (20 mM; B) but not glutamine (10 mM; C).
Figure 5
Figure 5
Comparison of glucose-evoked mitochondrial matrix alkalinisation, insulin secretion, mitochondrial calcium and cytosolic ATP rises in rat islets. Individual rat islets were analysed as described in Figure 2. (A) Average mitochondrial pH response. For clarity, the error bars (N=7) are displayed only every 120 s. Insulin secretion (B), mitochondrial calcium (C) and cytosolic ATP (D) were measured from groups of 100–150 islets. For mitochondrial calcium or ATP measurements, islets were infected with Ad-RIP-mtAequorin or Ad-RIP-Luciferase, respectively. Insulin samples were collected every 30 s from the efflux of mitochondrial calcium measurements.
Figure 6
Figure 6
Mitochondrial calcium signals play little or no role in mitochondrial matrix alkalinisation or hyperpolarisation of the electrical potential in β-cell mitochondria. (A) Intact rat islets expressing mtAlpHi were stimulated with 16.7 mM glucose in the absence of extracellular calcium (KRBH containing 16.7 mM glucose, 0 mM calcium chloride, 0.4 mM EGTA). As indicated, EGTA was then removed and 1.5 mM calcium chloride was added. (B) Glucose responses of the pHmito in the absence of extracellular calcium. Values are presented as mean±s.e.m. (N=4). (C) Rat islets expressing mtAlpHi were stimulated with tolbutamide (500 μM) followed by glucose (16.7 mM) in the continued presence of tolbutamide. (D) Ratiometric measurements of JC-1 fluorescence changes during glucose stimulation (Materials and methods). Dispersed rat islet cells were loaded with JC-1. Changes in fluorescence ratios from basal levels were normalised to ratio differences between resting and maximal depolarisation induced by 10 μM FCCP and expressed as percent changes of the mitochondrial membrane potential. At the end of the trace, EGTA was removed and 1.5 mM calcium was added to the cells lacking extracellular calcium. Average glucose responses in the presence (black trace) or absence of extracellular calcium (grey trace; 0.4 mM EGTA) are shown. (E) Quantification of the ratio changes. (F) Rat islets expressing mtAlpHi were treated with 1 μM rotenone and then stimulated with 16.7 mM glucose. (G) Average pHmito responses of rat islets to glucose in the presence of 1 μM rotenone.
Figure 7
Figure 7
Kinetic comparison of matrix alkalinisation and the increase of the mitochondrial electrical potential. INS-1E cells expressing mtAlpHi (A; N=6) or loaded with JC-1 (B; N=7) were stimulated with 16.7 mM glucose. For clarity, standard errors are included only every 120 s. FCCP (10 μM) was used to depolarise the mitochondria.
Figure 8
Figure 8
Lowering of the pHmito in permeabilised cells strongly reduces mitochondrial ATP synthesis. INS-1E cells were permeabilised with α-hemolysin toxin and analysed for mitochondrial matrix pH changes (A, B), mitochondrial membrane potential polarisation (C, D) and ATP generation (E, F). Mitochondria of the permeabilised cells were stimulated with either 1 mM succinate (A, B, C, E) or 10 mM DL-α-glycerolphosphate (D, F). (A) Nigericin caused acidification of the mitochondrial matrix at both 100 and 500 nM. (B) Quantification of the mitochondrial pH measurements (N=4–7). The same concentrations (C, D and data not shown) resulted in hyperpolarisation of the inner mitochondrial membrane (N=6–8). Nigericin strongly reduced ATP generation from both 1 mM succinate (E) and 10 mM DL-α-glycerolphosphate (F) oxidation (N=3–8). Values are presented as mean±s.e.m.

Comment in

References

    1. Abad MF, Di Benedetto G, Magalhaes PJ, Filippin L, Pozzan T (2004) Mitochondrial pH monitored by a new engineered green fluorescent protein mutant. J Biol Chem 279: 11521–11529 - PubMed
    1. Balut C, vandeVen M, Despa S, Lambrichts I, Ameloot M, Steels P, Smets I (2008) Measurement of cytosolic and mitochondrial pH in living cells during reversible metabolic inhibition. Kidney Int 73: 226–232 - PubMed
    1. Brun T, Franklin I, St-Onge L, Biason-Lauber A, Schoenle EJ, Wollheim CB, Gauthier BR (2004) The diabetes-linked transcription factor PAX4 promotes {beta}-cell proliferation and survival in rat and human islets. J Cell Biol 167: 1123–1135 - PMC - PubMed
    1. Cline GW, Lepine RL, Papas KK, Kibbey RG, Shulman GI (2004) 13C NMR isotopomer analysis of anaplerotic pathways in INS-1 cells. J Biol Chem 279: 44370–44375 - PubMed
    1. Cline GW, Vidal-Puig AJ, Dufour S, Cadman KS, Lowell BB, Shulman GI (2001) In vivo effects of uncoupling protein-3 gene disruption on mitochondrial energy metabolism. J Biol Chem 276: 20240–20244 - PubMed

Publication types