. 2009 Jan 20;7(1):e16.
doi: 10.1371/journal.pbio.1000016.

A novel function for fragile X mental retardation protein in translational activation

Affiliations

A novel function for fragile X mental retardation protein in translational activation

Elias G Bechara et al. PLoS Biol. .

Abstract

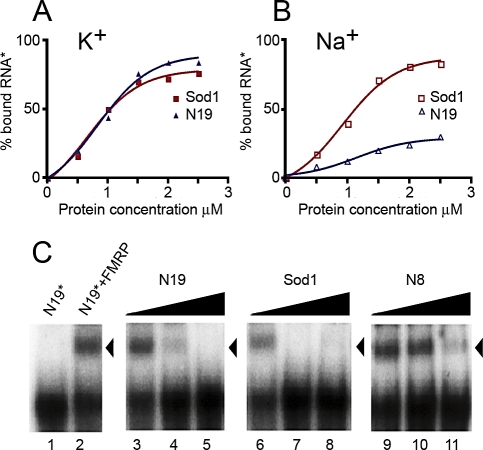
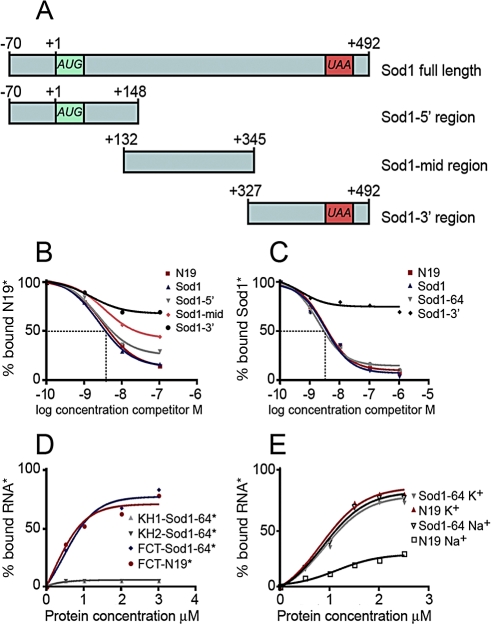
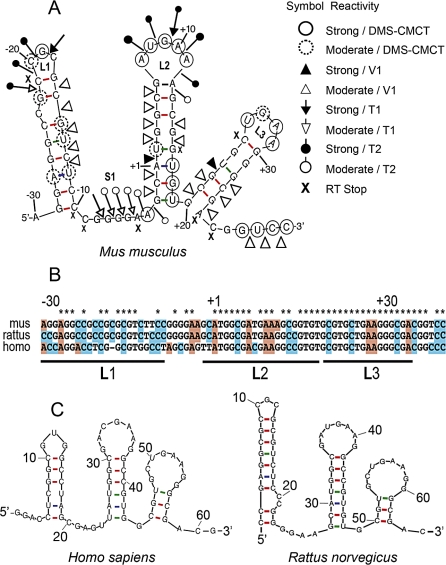
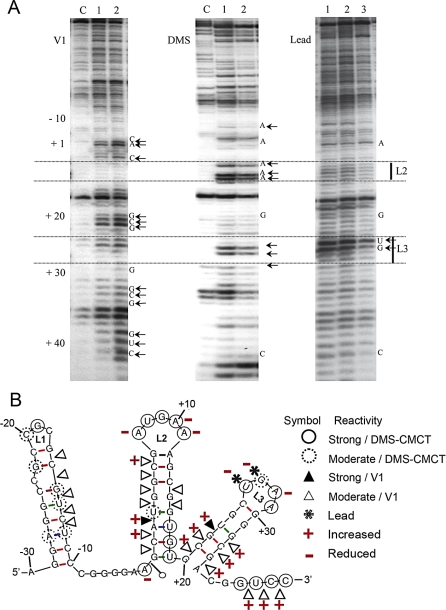
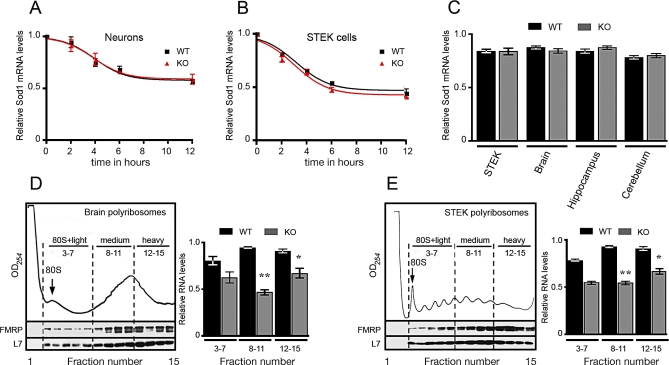
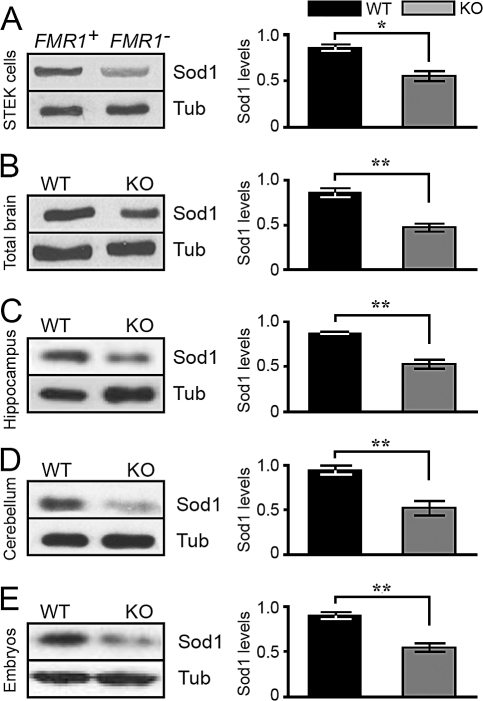
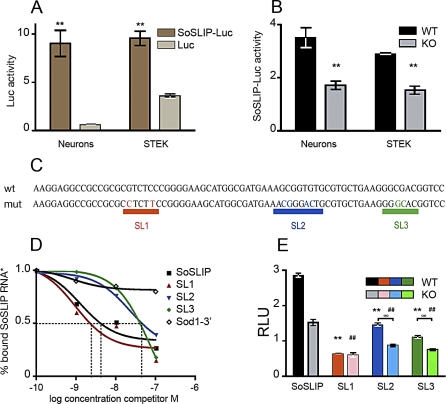
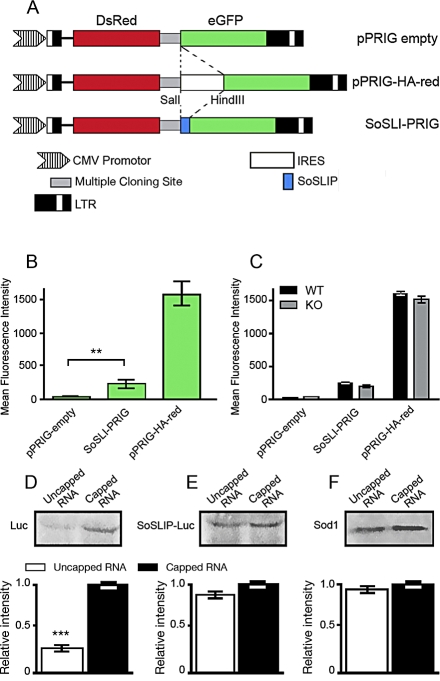
Fragile X syndrome, the most frequent form of inherited mental retardation, is due to the absence of Fragile X Mental Retardation Protein (FMRP), an RNA-binding protein involved in several steps of RNA metabolism. To date, two RNA motifs have been found to mediate FMRP/RNA interaction, the G-quartet and the "kissing complex," which both induce translational repression in the presence of FMRP. We show here a new role for FMRP as a positive modulator of translation. FMRP specifically binds Superoxide Dismutase 1 (Sod1) mRNA with high affinity through a novel RNA motif, SoSLIP (Sod1 mRNA Stem Loops Interacting with FMRP), which is folded as three independent stem-loop structures. FMRP induces a structural modification of the SoSLIP motif upon its interaction with it. SoSLIP also behaves as a translational activator whose action is potentiated by the interaction with FMRP. The absence of FMRP results in decreased expression of Sod1. Because it has been observed that brain metabolism of FMR1 null mice is more sensitive to oxidative stress, we propose that the deregulation of Sod1 expression may be at the basis of several traits of the physiopathology of the Fragile X syndrome, such as anxiety, sleep troubles, and autism.


Conflict of interest statement

Competing interests. The authors have declared that no competing interests exist.

Figures

Figure 1
Figure 1. FMRP Specifically Binds Sod1 mRNA
FMRP binding to Sod1 mRNA is not dependent on K+. Labeled G-quartet RNA (N19) or Sod1 full-length mRNA were incubated with increasing amounts of recombinant His-FMRP in the presence of K+(A) or Na+(B). FMRP/Sod1 binding was not affected by ionic conditions, whereas, as expected, the presence of Na+ affected FMRP binding to N19. (C) Gel-shift experiments were performed using a 32P-labeled N19 probe incubated with 0.1 pmol of recombinant His-tagged FMRP in the presence of increasing amounts of unlabeled competitors, ranging from 10−9 to 10−7M [lanes 3–5 (N19), lanes 6–8 (Sod1), lanes 9–11 (N8)]. Lane 1, no protein control; lane 2, no competitor control. Note that both N19 (positive control) and Sod1 compete equally well for binding to FMRP, whereas N8 (negative control) only competes at high concentrations (nonspecific binding). All data obtained in these experiments are listed in Table S2.
Figure 2
Figure 2. FMRP Binds a 64 Base Fragment of Sod1 mRNA via Its C-Terminal Region
(A) Schematic representation of Sod1 mRNA and its fragments subcloned from full-length cDNA and used to map the binding domain of FMRP on Sod1 mRNA. (B) Binding specificity of FMRP to Sod1–5′ region. Filter binding assay using FMRP and 32P-labeled N19. The competition was performed using various regions of unlabeled Sod1 mRNA: Sod1–5′ region, Sod1-mid region, Sod1–3′ region, and N19 itself. The graph shows the fraction of bound labeled N19 RNA plotted versus unlabeled competitor RNA concentration. (C) Binding specificity of FMRP to Sod1–64 fragment. Filter binding assay using FMRP and 32P-labeled Sod1 mRNA. Competition was performed with different unlabeled mRNA fragments, as indicated in the figure The Sod1–64 RNA fragment shows a competition profile similar to that of Sod1 full-length mRNA. (D) Filter binding assays using various recombinant RNA-binding domains of FMRP. KH1, KH2, and the C-terminal domain containing the RGG box and 32P-labeled RNAs reveal that the FMRP C-terminal domain displays equal affinity for Sod1 mRNA or G-quartet (N19 fragment), whereas the two KH domains are not able to bind Sod1 mRNA. (E) Filter binding assay using increasing amounts of recombinant His-FMRP and 32P-labeled RNA fragments in the presence of K+ or Na+. FMRP/Sod1–64 RNA binding is not dependent on ionic conditions, excluding the presence of a G-quartet-forming structure RNA. All data are listed in Table S2.
Figure 3
Figure 3. Secondary Structure of the SoSLIP RNA Fragment
(A) RNA secondary structure model of the mouse Sod1–64 RNA fragment (SoSLIP) showing results from enzymatic cleavage and chemical modification experiments. White and black arrows represent moderate and strong RNase T1 cleavage sites, respectively. White and black triangles represent moderate and strong RNase V1 cleavage sites, respectively. Symbols used to indicate the reactivity of different drugs or nucleases are shown in the figure; “X” represents RT pauses. (B) Alignment of SoSLIP sequence in mouse, rat, and human. (C) Conservation of the SoSLIP RNA secondary structure in rat and human.
Figure 4
Figure 4. Chemical and Enzymatic Probing of the SoSLIP and Its Resulting Secondary Structure in the Presence and in the Absence of FMRP
(A) PAGE gel showing the running of retrotranscribed SoSLIP RNA after treatment with RNase V1 (left), DMS (middle), and lead (right). “C” indicates the lane where SoSLIP was untreated, lane 1 is the treated RNA, and lanes 2 and 3 represent the SoSLIP RNA after incubation with an increasing amount of FMRP before being treated as described. The positions of nucleotides are indicated together with the region corresponding to the second (L2) and third (L3) loops. (B) RNA secondary structure model of SoSLIP showing results from enzymatic cleavage and chemical modification experiments in the presence of FMRP. The symbols indicating reactivity toward V1, DMS, or lead are shown on the right. The two symbols + and – were used to indicate an increased or decreased reactivity, respectively, upon the interaction with FMRP.
Figure 5
Figure 5. Stability and Translatability of Sod1 mRNA
(A) Primary cultured hippocampal neurons derived from Fmr1 knockout or wild-type mice were incubated with 5 μM actinomycin D. Total RNA was extracted at different times (2, 4, 6, and 12 h) after the treatment, and Sod1 mRNA was quantified by qRT-PCR as described [37]. All results are listed in Table S2. (B) STEK cells expressing or not expressing FMRP were incubated with 5 μM actinomycin D. Total RNA was extracted at different times (2, 4, 6, and 12 h) after the treatment, and Sod1 mRNA was quantified by qRT-PCR as described [37]. Values are listed in Table S2. (C) Cytoplasmic RNA was extracted from cells and mice tissues expressing or not expressing FMRP. The Sod1 mRNA level was normalized by the Hprt mRNA level by applying the formula: Ct Sod1/Ct Hprt. As shown in the diagram, the Sod1 mRNA levels were not affected by the absence of FMRP, and no statistically significant differences were observed for Sod1 mRNA levels in tissues and cell lines expressing or not expressing FMRP. Results are presented as the mean ± SEM. (D) Polyribosome association of Sod1 mRNA in brain obtained from wild-type and Fmr1 null mice. The UV profile of a sucrose density gradient is shown, and the 80S monosome peak is indicated. RNA purified from fractions corresponding to 80S and light-, medium-, and heavy-sedimenting polyribosomes were pooled, and the Sod1 mRNA levels in each pool were determined by qRT-PCR by applying the formula: Ct Sod1/Ct Hprt. Sod1 mRNA is less associated with medium and heavy polyribosomes in the absence of FMRP. Results are presented as the mean ± SEM (Student's t-test, **p < 0.01 for medium polyribosomes) (Student's t-test, *p < 0.05 for heavy polyribosomes). No statistically significant differences were observed for light polyribosomes. (E) Polyribosome association of Sod1 mRNA in STEK cell lines expressing or not expressing FMR1. The UV profile of a sucrose density gradient is shown, and the 80S monosome peak is indicated. RNA purified from fractions corresponding to 80S and light-, medium-, and heavy-sedimenting polyribosomes were pooled, and the Sod1 mRNA level in each pool was quantified as described in (D). Sod1 mRNA is reduced in medium and heavy polyribosomes in the absence of FMRP. Results are presented as the mean ± SEM (Student's t-test, **p < 0.01 for medium polyribosomes) (Student's t-test, *p < 0.05 for heavy polyribosomes). No statistically significant differences were observed for light polyribosomes.
Figure 6
Figure 6. Decreased Levels of Sod1 Protein in Fmr1 Null Cells, Brain, and Embryos
Western blot analysis of one FMR1 + STEK clone (where FMR1 was reintroduced) and one STEK FMR1 null clone. The results shown on the left are representative of the different clonal cell lines. On the right, corresponding densitometric analyses show a significant decrease of Sod1 expression, after comparing five wild-type rescued clones and five FMR1 knockout clones. Three independent experiments were quantified. Results presented as the mean ± SEM (Student's t-test, *p < 0.05) are the average of Sod1 levels normalized for β-tubulin expression The same analysis described in (A) was applied for mouse total brain (B), mouse hippocampus (C), mouse cerebellum (B) and mouse 10dpc embryo extracts (E). Densitometric analysis showing a significant decrease in Sod1 expression. Three independent experiments were quantified using eight wild-type and eight Fmr1 null mice. Results presented as the mean ± SEM (Student's t-test, **p < 0.01) are the average of Sod1 levels normalized for β-tubulin expression.
Figure 7
Figure 7. Impact of SoSLIP on Translational Regulation
(A) Effect of SoSLIP sequence upon luciferase expression: luciferase activities of Luc or SoSLIP-Luc vectors in primary neurons and STEK cells. Three independent experiments with three replicates, done in triplicate, for each transfection were quantified. For each transfection, firefly(F) luciferase (luc) activity was normalized by Renilla (R) luciferase (luc) activity. Results are presented as the mean ± SEM (Student's t-test, **p < 0.01). (B) Activity of SoSLIP-Luc in neurons and STEK cells expressing or not expressing FMRP. Three independent experiments in triplicate for each transfection were quantified. For each transfection, Fluc activity was normalized by Rluc activity. Results presented here represent the mean ± SEM of the ratio of SoSLIP-Luc to Luc activities (Student's t-test, **p < 0.01). (C) Schematic representation of the wild-type SoSLIP sequence and its three mutants (SL1, SL2, and SL3). (D) Binding affinity of FMRP to wild-type SoSLIP and SL1, SL2, and SL3 mutants. Filter binding assay using radiolabeled SoSLIP and unlabeled cold RNA competitors SoSLIP, Sod1–3′ region, SL1, SL2, and SL3. All of the results obtained in the filter binding assay are listed in Table S2. (E) Effect of SoSLIP mutants (SL1-Luc, SL2-Luc, and SL3-Luc) on luciferase expression in STEK cells expressing or not expressing FMRP. Three independent experiments in triplicate for each transfection were quantified. For each transfection, Fluc activity was normalized to Rluc activity. Results presented here represent the mean of the ratio of SoSLIP-Luc to Luc, SL1-Luc to Luc, SL2-Luc to Luc, and SL3-Luc to Luc. The luciferase activities of the three mutants were compared to wild-type SoSLIP luciferase activity in cells expressing FMRP, and the difference was significant in all cases (Student's t-test, **p < 0.01). The same analysis was repeated in cells not expressing FMRP, and the difference was significant in all cases (Student's t-test, ##p < 0.01). The luciferase activity of each mutant in cells expressing or not expressing FMRP was evaluated. For mutants SL2 and SL3, the reduction of lucferase activity observed in Fmr1 null cells was statistically significant. These results are presented as the mean ± SEM (Student's t-test, °°p < 0.01). For mutant SL1, no significant reduction of luciferase activity was observed in cells not expressing FMRP compared with cells expressing FMRP. These results are presented as the mean ± SEM. RLU, relative luciferase units.
Figure 8
Figure 8. SoSLIP Acts as an FMRP-Independent IRES-like Element
(A) Diagram of different constructs containing both DsRed and eGFP. These plasmids were modified by insertion of either a linker sequence (pPRIG-empty), the SoSLIP sequence (SoSLI-PRIG), or a characterized IRES (pPRIG-HA-red). (B) Histogram showing eGFP intensity (green) in a FACScan analysis on HeLa cells transfected with pPRIGempty, SoSLI-PRIG, or pPRIG-HA-red vectors. Two-hundred thousand cells positive for DsRed expression were analyzed for each transfection, and three independent experiments were quantified. The mean intensity of eGFP was calculated by the instrument software. Statistical analysis shows a significant difference between the mean intensity of GFP obtained by the pPRIGempty vector and that obtained by the SoSLI-PRIG vector (Student's t-test, **p < 0.01). (C) The same analysis described in (B) was repeated in STEK cells expressing or not expressing the FMR1 transgene. Statistical analysis does not show a significant difference between the mean intensity of GFP in cells expressing or not expressing FMRP. Results are presented as the mean ± SEM. (D) In vitro translated capped and noncapped mRNA luciferase (Luc vector) in WGE. The relative intensity of each band was evaluated by densitometric analysis, and the values obtained are represented in the histograms. Four different experiments were quantified, and results are presented as the mean ± SEM (Student's t-test, ***p < 0.001). (E) The same experiment described in (D) was repeated for the in vitro translation of SoSLIP-Luc mRNA. Four different experiments were evaluated, and no statistically significant differences were observed. (F) The same experiment described in (D) was repeated for the in vitro translation of Sod1 mRNA. Four different experiments were evaluated, and no statistically significant differences were observed. As in (D), in (E) and (F), results are presented as the mean ± SEM.

References

    1. Bardoni B, Davidovic L, Bensaid M, Khandjian EW. The fragile X syndrome: exploring its molecular basis and seeking a treatment. Expert Rev Mol Med. 2006;8:1–16. - PubMed
    1. Darnell JC, Fraser CE, Mostovetsky O, Stefani G, Jones TA, et al. Kissing complex RNAs mediate interaction between the Fragile-X mental retardation protein KH2 domain and brain polyribosomes. Genes Dev. 2005;19:903–918. - PMC - PubMed
    1. Darnell JC, Jensen KB, Jin P, Brown V, Warren ST, et al. Fragile X mental retardation protein targets G-quartet mRNAs important for neuronal function. Cell. 2001;107:489–499. - PubMed
    1. Schaeffer C, Bardoni B, Mandel JL, Ehresmann B, Ehresmann C, et al. The fragile X mental retardation protein binds specifically to its mRNA via a purine quartet motif. EMBO J. 2001;20:4803–4813. - PMC - PubMed
    1. Castets M, Schaeffer C, Bechara E, Schenck A, Khandjian EW, et al. FMRP interferes with Rac1 pathway and controls actin cytoskeleton dynamics in murine fibroblasts. Hum Mol Genet. 2005;14:835–844. - PubMed

Publication types