

Molecular receptive range variation among mouse odorant receptors for aliphatic carboxylic acids
- PMID: 19166503
- PMCID: PMC2670241
- DOI: 10.1111/j.1471-4159.2009.05925.x
Molecular receptive range variation among mouse odorant receptors for aliphatic carboxylic acids
Abstract
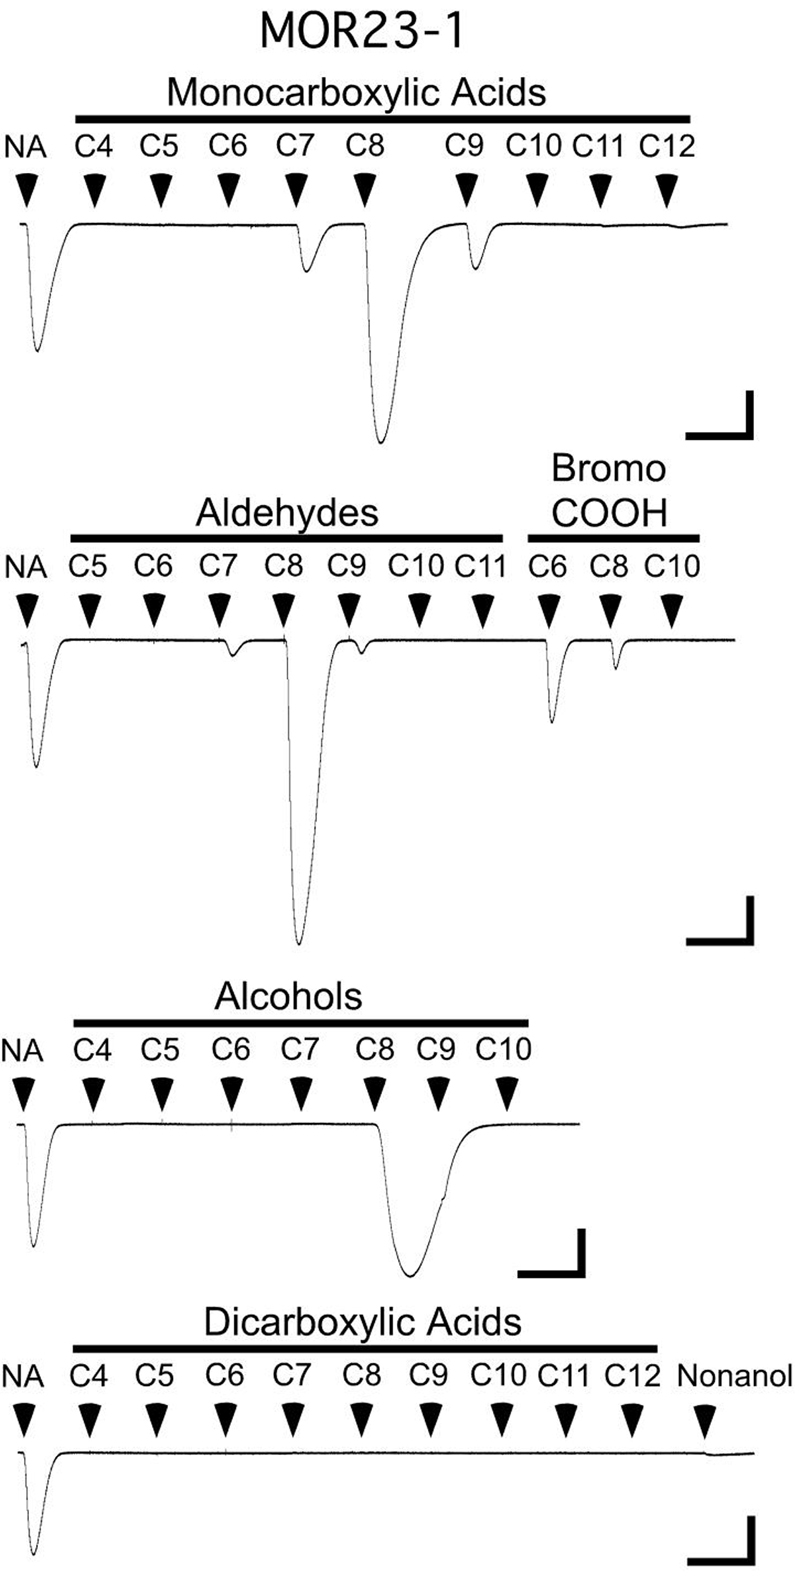
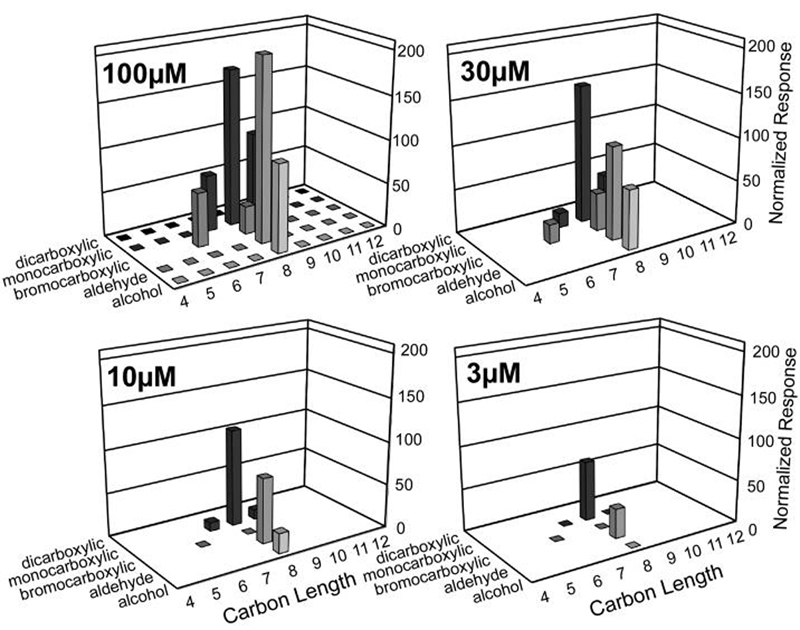
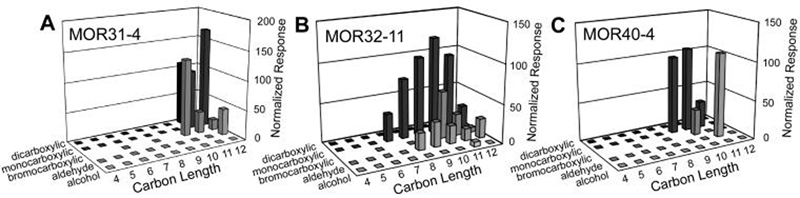
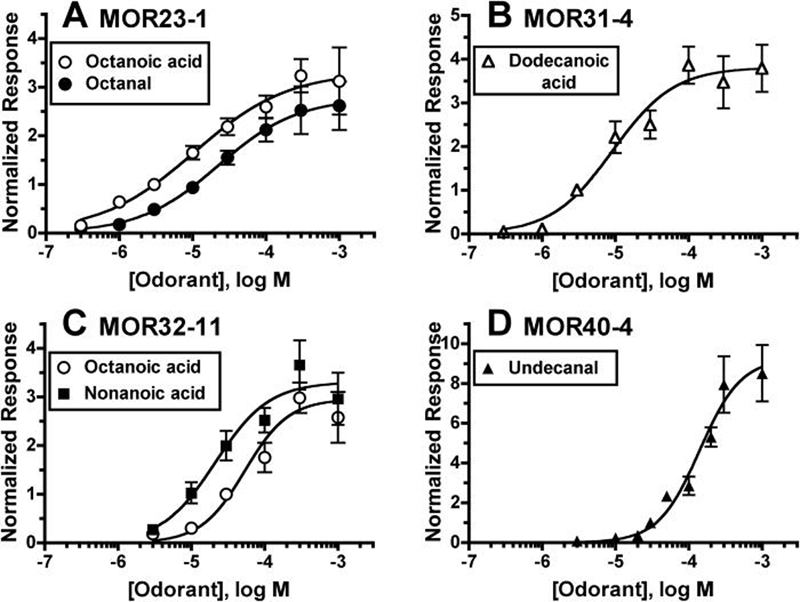
The ability of mammals to identify and distinguish among many thousands of different odorants suggests a combinatorial use of odorant receptors, with each receptor detecting multiple odorants and each odorant interacting with multiple receptors. Numerous receptors may be devoted to the sampling of particularly important regions of odor space. In this study, we explore the similarities and differences in the molecular receptive ranges of four mouse odorant receptors (MOR23-1, MOR31-4, MOR32-11 and MOR40-4), which have previously been identified as receptors for aliphatic carboxylic acids. Each receptor was expressed in Xenopus oocytes, along with Galpha(olf) and the cystic fibrosis transmembrane regulator to allow electrophysiological assay of receptor responses. We find that even though these receptors are relatively unrelated, there is extensive overlap among their receptive ranges. That is, these receptors sample a similar region of odor space. However, the receptive range of each receptor is unique. Thus, these receptors contribute to the depth of coverage of this small region of odor space. Such a group of receptors with overlapping, but distinct receptive ranges, may participate in making fine distinctions among complex mixtures of closely related odorant compounds.
Figures

Similar articles
-
Functional analysis of a mammalian odorant receptor subfamily.J Neurochem. 2006 Jun;97(5):1506-18. doi: 10.1111/j.1471-4159.2006.03859.x. Epub 2006 Apr 5. J Neurochem. 2006. PMID: 16606354 Free PMC article.
-
Mammalian odorant receptor tuning breadth persists across distinct odorant panels.PLoS One. 2017 Sep 25;12(9):e0185329. doi: 10.1371/journal.pone.0185329. eCollection 2017. PLoS One. 2017. PMID: 28945824 Free PMC article.
-
Receptive range analysis of a mouse odorant receptor subfamily.J Neurochem. 2015 Jul;134(1):47-55. doi: 10.1111/jnc.13095. Epub 2015 Mar 25. J Neurochem. 2015. PMID: 25772782 Free PMC article.
-
Odor discrimination by G protein-coupled olfactory receptors.Microsc Res Tech. 2002 Aug 1;58(3):135-41. doi: 10.1002/jemt.10131. Microsc Res Tech. 2002. PMID: 12203691 Review.
-
Combining In Vivo and In Vitro Approaches To Identify Human Odorant Receptors Responsive to Food Odorants.J Agric Food Chem. 2018 Mar 14;66(10):2214-2218. doi: 10.1021/acs.jafc.6b04998. Epub 2017 Jan 17. J Agric Food Chem. 2018. PMID: 28054485 Review.
Cited by
-
Mammalian olfactory receptors: pharmacology, G protein coupling and desensitization.Cell Mol Life Sci. 2009 Dec;66(23):3743-53. doi: 10.1007/s00018-009-0111-6. Epub 2009 Aug 4. Cell Mol Life Sci. 2009. PMID: 19652915 Free PMC article. Review.
-
Structure-activity relationships on the odor detectability of homologous carboxylic acids by humans.Exp Brain Res. 2010 Nov;207(1-2):75-84. doi: 10.1007/s00221-010-2430-0. Epub 2010 Oct 8. Exp Brain Res. 2010. PMID: 20931179 Free PMC article.
-
OlfactionBase: a repository to explore odors, odorants, olfactory receptors and odorant-receptor interactions.Nucleic Acids Res. 2022 Jan 7;50(D1):D678-D686. doi: 10.1093/nar/gkab763. Nucleic Acids Res. 2022. PMID: 34469532 Free PMC article.
-
M2OR: a database of olfactory receptor-odorant pairs for understanding the molecular mechanisms of olfaction.Nucleic Acids Res. 2024 Jan 5;52(D1):D1370-D1379. doi: 10.1093/nar/gkad886. Nucleic Acids Res. 2024. PMID: 37870437 Free PMC article.
-
A transcriptional rheostat couples past activity to future sensory responses.Cell. 2021 Dec 22;184(26):6326-6343.e32. doi: 10.1016/j.cell.2021.11.022. Epub 2021 Dec 7. Cell. 2021. PMID: 34879231 Free PMC article.
References
-
- Abaffy T, Malhotra A, Luetje CW. The molecular basis for ligand specificity in a mouse olfactory receptor: A network of functionally important residues. J. Biol. Chem. 2007;282:1216–1224. - PubMed
-
- Araneda RC, Kini AD, Firestein S. The molecular receptive range of an odorant receptor. Nat. Neurosci. 2000;3:1248–1255. - PubMed
Publication types
MeSH terms
Substances
Grants and funding
LinkOut - more resources
Full Text Sources
Other Literature Sources
Molecular Biology Databases
