Comparative Study
. 2009 Jan 23:10:45.
doi: 10.1186/1471-2164-10-45.

An analysis of synteny of Arachis with Lotus and Medicago sheds new light on the structure, stability and evolution of legume genomes

Affiliations
Comparative Study

An analysis of synteny of Arachis with Lotus and Medicago sheds new light on the structure, stability and evolution of legume genomes

David J Bertioli et al. BMC Genomics. .

Abstract

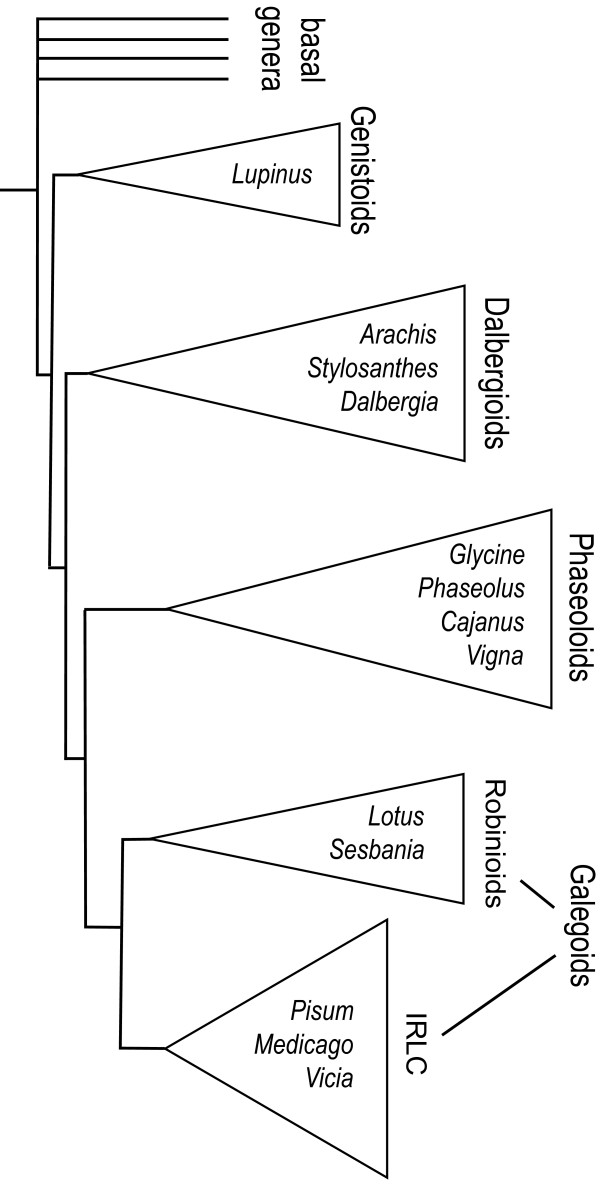
Background: Most agriculturally important legumes fall within two sub-clades of the Papilionoid legumes: the Phaseoloids and Galegoids, which diverged about 50 Mya. The Phaseoloids are mostly tropical and include crops such as common bean and soybean. The Galegoids are mostly temperate and include clover, fava bean and the model legumes Lotus and Medicago (both with substantially sequenced genomes). In contrast, peanut (Arachis hypogaea) falls in the Dalbergioid clade which is more basal in its divergence within the Papilionoids. The aim of this work was to integrate the genetic map of Arachis with Lotus and Medicago and improve our understanding of the Arachis genome and legume genomes in general. To do this we placed on the Arachis map, comparative anchor markers defined using a previously described bioinformatics pipeline. Also we investigated the possible role of transposons in the patterns of synteny that were observed.

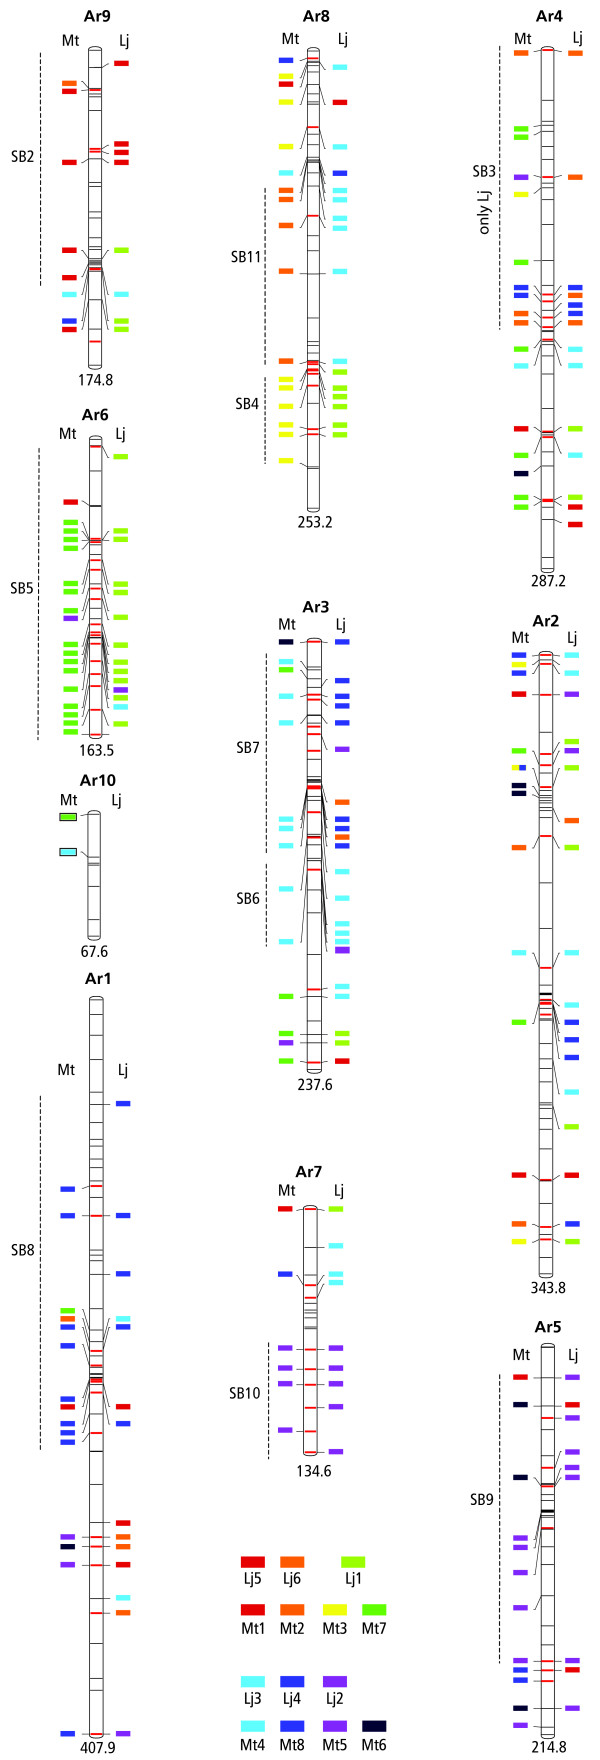
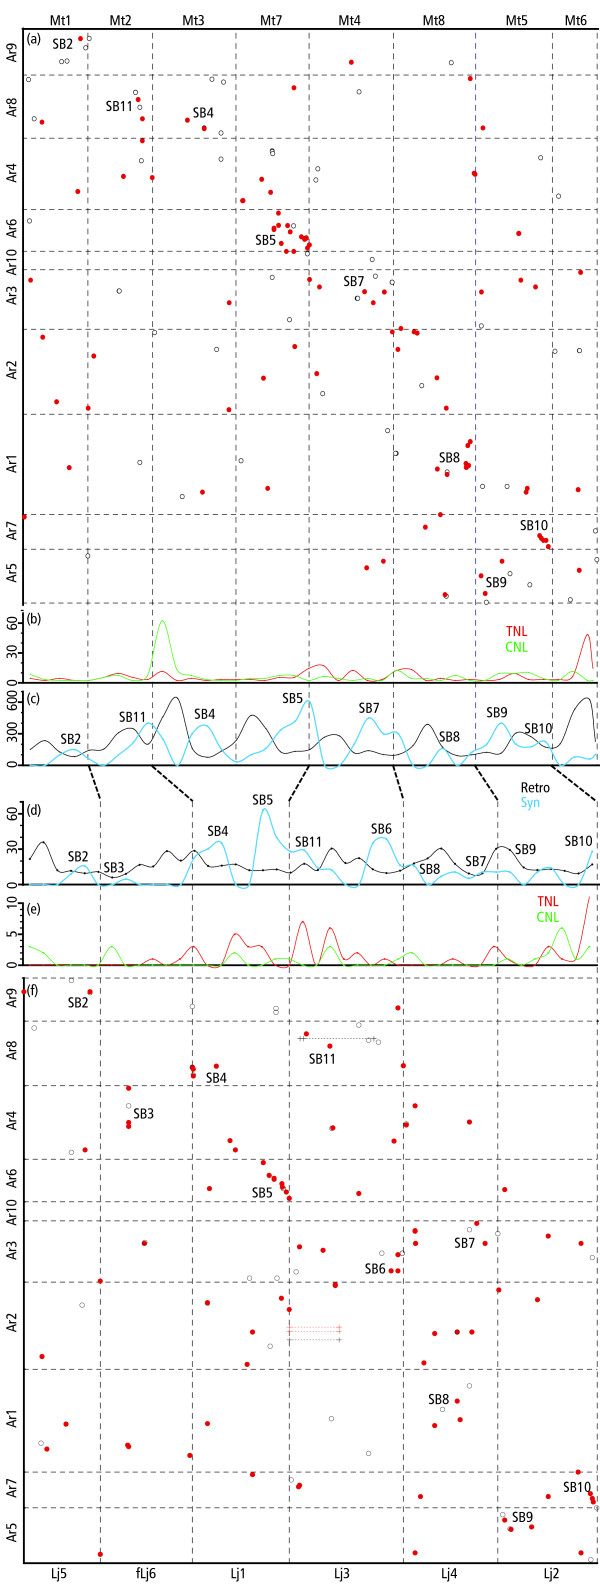
Results: The Arachis genetic map was substantially aligned with Lotus and Medicago with most synteny blocks presenting a single main affinity to each genome. This indicates that the last common whole genome duplication within the Papilionoid legumes predated the divergence of Arachis from the Galegoids and Phaseoloids sufficiently that the common ancestral genome was substantially diploidized. The Arachis and model legume genomes comparison made here, together with a previously published comparison of Lotus and Medicago allowed all possible Arachis-Lotus-Medicago species by species comparisons to be made and genome syntenies observed. Distinct conserved synteny blocks and non-conserved regions were present in all genome comparisons, implying that certain legume genomic regions are consistently more stable during evolution than others. We found that in Medicago and possibly also in Lotus, retrotransposons tend to be more frequent in the variable regions. Furthermore, while these variable regions generally have lower densities of single copy genes than the more conserved regions, some harbor high densities of the fast evolving disease resistance genes.

Conclusion: We suggest that gene space in Papilionoids may be divided into two broadly defined components: more conserved regions which tend to have low retrotransposon densities and are relatively stable during evolution; and variable regions that tend to have high retrotransposon densities, and whose frequent restructuring may fuel the evolution of some gene families.


Figures

Figure 1
Figure 1
A tree represention of the phylogeny of the Papilionoids with triangles representing the major clades, and the two subclades of the Galegoids; the Robinioids and the IRLC (plastid DNA Inverted Repeat Lacking Clade). Names of some notable genera are placed within the triangles. Note that Arachis which is a member of the Dalbergioids, represents a more basally diverged Papilionoid than the Galegoid legumes, and therefore serves as an out-group to a Lotus vs. Medicago comparison. The figure is a simplified and stylized phylogeny based on a tree in [2].
Figure 2
Figure 2
Arachis LGs with affinities to Lotus and Medicago chromosomes represented as colored blocks, and synteny blocks (SBs) indicated. Arachis LGs are numbered according to [4] with size in cM indicated below. Marker positions are indicated as horizontal lines across LGs, anchor markers as red lines, other markers as black lines. Colors were assigned to the model species chromosomes so that syntenous chromosomes are represented by corresponding colors. SBs are numbered according to [14], with the addition of SB11 identified in this study. A full genetic map is in Additional file 2.
Figure 3
Figure 3
Genome plots of Arachis vs. model legumes, and graphs of, synteny with Arachis, retrotransposon, and resistance gene homolog distributions for the model legumes. In the plots, marker correspondences are solid red dots for top Blastp and tBlastn homologies of anchor markers, and hollow black dots for top Blastn homologies of all sequence characterized markers. Chromosome orders and numbering of SBs (with addition of SB11) the same as in [14], allowing direct comparisons. Corresponding Medicago chromosomes and Lotus LGs are joined with slanted lines in the middle of the figure. For interactive versions of the plots see Additional file 1. (a) Genome Plot of Arachis (cM) vs. Medicago (bp). (b) Density of tBlastn detected sequence similarities (E-values < 1E-20) for the TNL (red line) and CNL (green line) subclasses of resistance gene homologs plotted along the Medicago genome. Values averaged over 6 Mbp window size. High densities of resistance gene homologs and retrotransposons coincide. (c) Black line: density of Blastn detected sequence similarities (E-values < E-60) for retrotransposons plotted along the Medicago genome. Cyan-blue line: synteny score of Medicago with Arachis scaled by multiplying by 100. Values averaged over 6 Mbp window size. SBs occur in regions of low retrotransposon density. (d) Percentage genome coverage of retrotransposons plotted along the Lotus genome (values averaged over 10 cM window size). Cyan-blue line: synteny score of Lotus with Arachis multiplied by 7. (Values averaged over 10 cM window size). SBs tend to occur in regions of low retrotransposon coverage. (e) Density of resistance gene homolog encoding sequences, TNL (red) and CNL (green), plotted along the Lotus genome (averaged over 10 cM window size). Clusters of resistance gene homologs and retrotransposons coincide. (f) Genome Plot of Arachis (cM) vs. Lotus MG-20 (cM). Markers mapped to intervals are plotted as horizontal lines. fLj indicates that the Lotus chromosome has been inverted. The reference orientation of Lj5 has recently been inverted, thus Lj5 in this plot is equivalent to fLj5 in [14].

Similar articles

Cited by

References

    1. Lewis G, Schrire B, Mackinder B, Lock M, (Editors) Legumes of the World. Kew Publishing; 2005. ISBN 1 900 34780 6.
    1. Wojciechowski MF, Lavin M, Sanderson MJ. A phylogeny of legumes (Leguminosae) based on analysis of the plastid MatK gene resolves many well-supported subclades within the family. Am J Bot. 2004;91:1846–1862. doi: 10.3732/ajb.91.11.1846. - DOI - PubMed
    1. FAOSTAT http://faostat.fao.org
    1. Moretzsohn MC, Leoi L, Proite K, Guimarães PM, Leal-Bertioli SCM, Gimenes MA, Martins WS, Valls J, Grattapaglia D, Bertioli DJ. A Microsatellite bsed, gene-rich linkage map for the AA genome of Arachis (Fabaceae) Theor Appl Genet. 2005;111:1060–1071. doi: 10.1007/s00122-005-0028-x. - DOI - PubMed
    1. Kochert G, Stalker HT, Gimenes M, Galgaro L, Lopes CR, Moore K. RFLP and cytogenetic evidence on the origin and evolution of allotetraploid domesticated peanut, Arachis hypogaea (Leguminosae) Am J Bot. 1996;83:1282–1291. doi: 10.2307/2446112. - DOI

Publication types

LinkOut - more resources