. 2009 Mar;116(3):488-496.e2.
doi: 10.1016/j.ophtha.2008.10.006. Epub 2009 Jan 22.

Photoreceptor layer thinning over drusen in eyes with age-related macular degeneration imaged in vivo with spectral-domain optical coherence tomography

Affiliations

Photoreceptor layer thinning over drusen in eyes with age-related macular degeneration imaged in vivo with spectral-domain optical coherence tomography

Stefanie G Schuman et al. Ophthalmology. 2009 Mar.

Abstract

Purpose: Detect changes in the neurosensory retina using spectral-domain optical coherence tomography (SD OCT) imaging over drusen in age-related macular degeneration (AMD). Quantitative imaging biomarkers may aid in defining risk of disease progression.

Design: Cross-sectional, case-control study evaluating SD OCT testing in AMD.

Participants and controls: Seventeen eyes of 12 subjects with nonneovascular AMD and drusen and 17 eyes of 10 age-matched control subjects.

Methods: Spectral-domain OCT imaging across the fovea in the study eye with multiple 10- to 12-mm scans of 1000 A scans each.

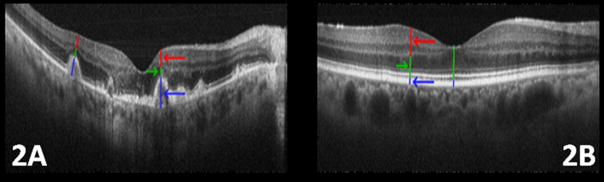
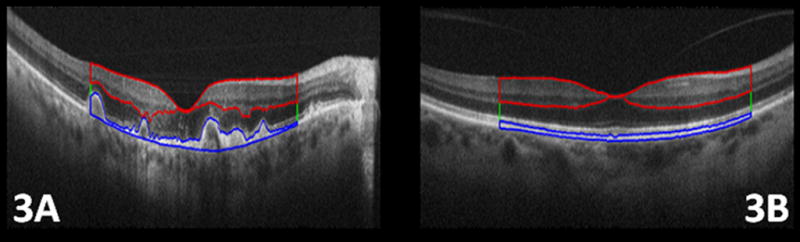
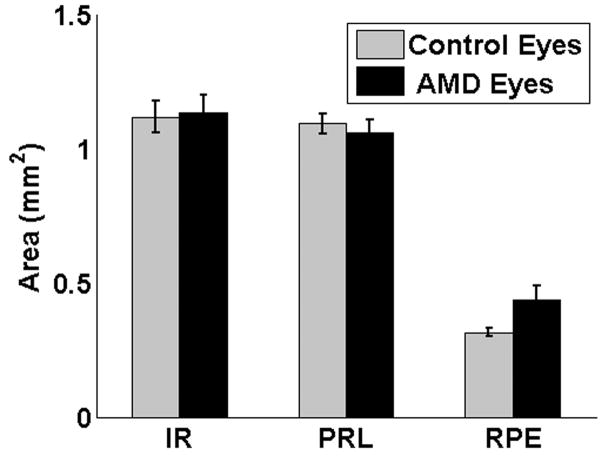
Main outcome measures: In summed SD OCT scans, the height of individual retinal layers either over drusen or at corresponding locations in the control eye and qualitative changes in retinal layers over drusen. Secondary measures included photoreceptor layer (PRL) area, inner retinal area, and retinal pigment epithelium (RPE)/drusen area.

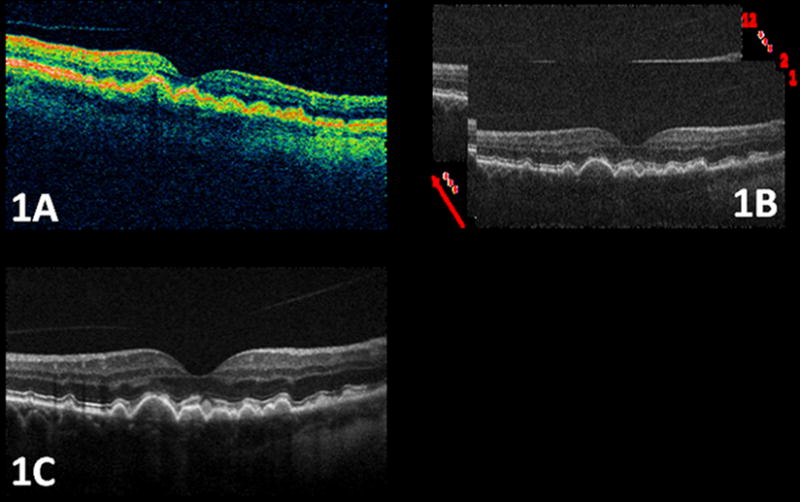
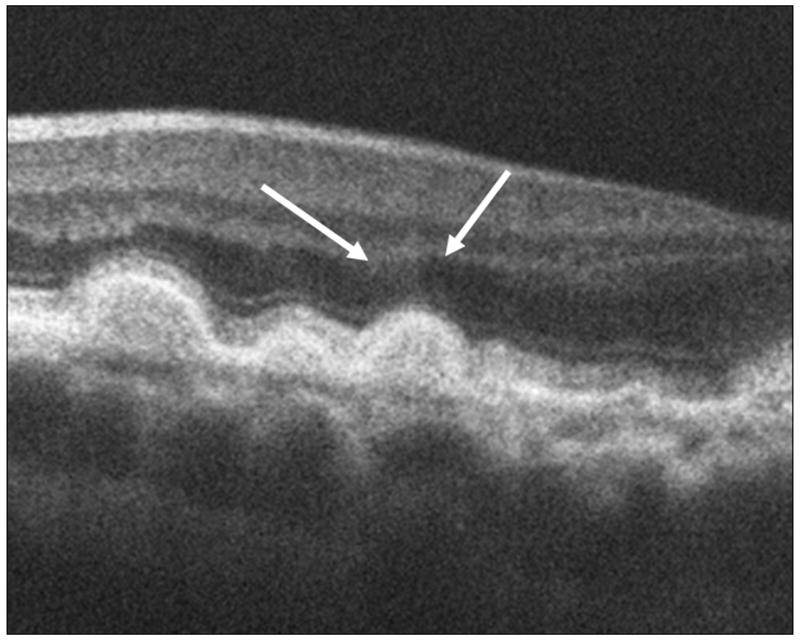
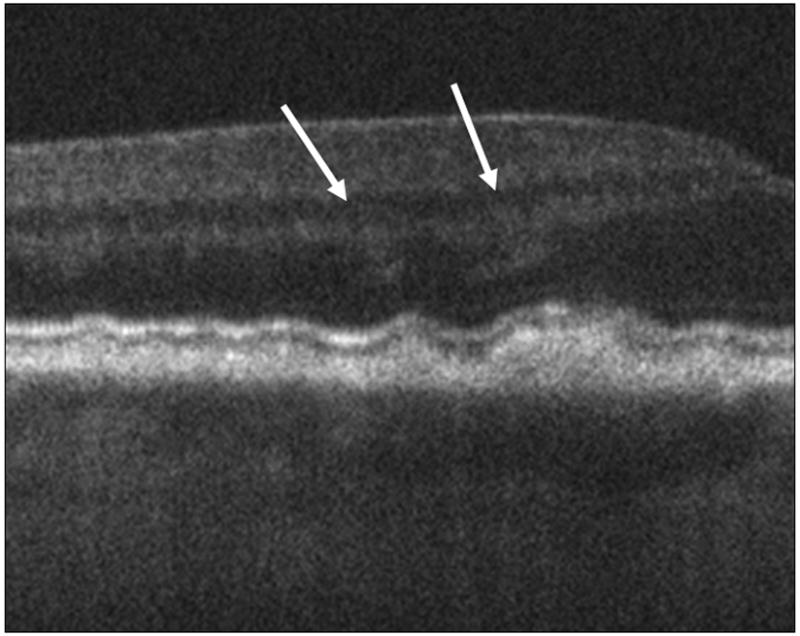
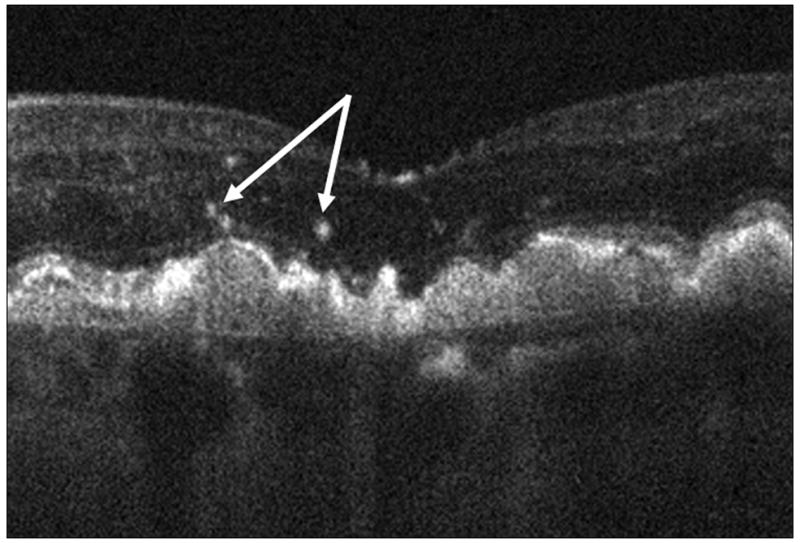
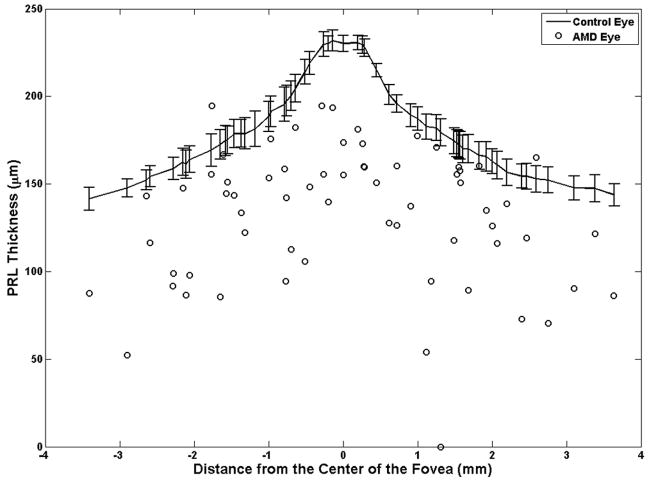
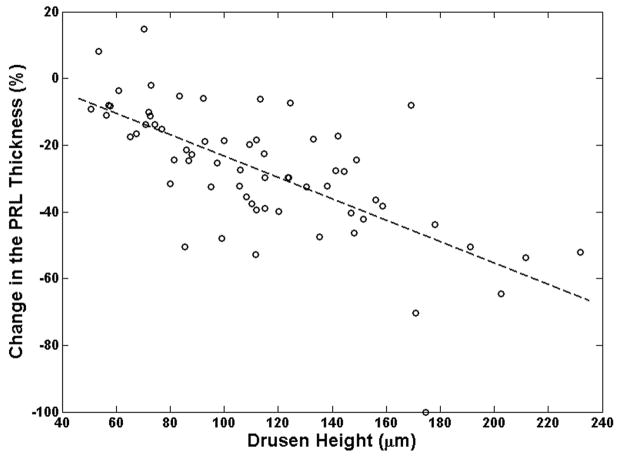
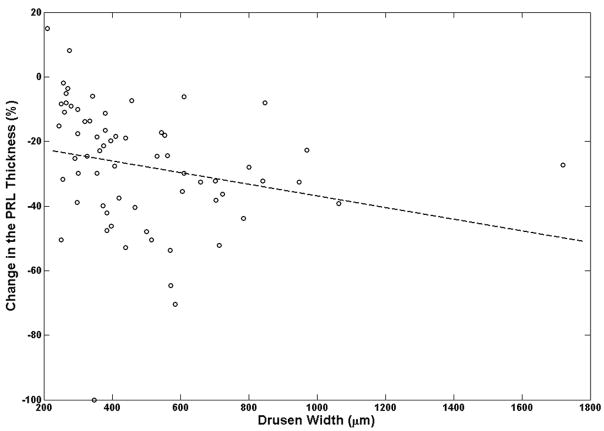
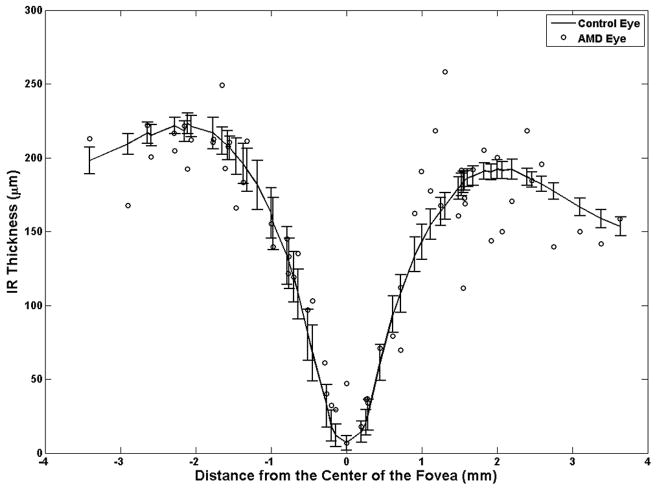
Results: The PRL was thinned over 97% of drusen, average PRL thickness was reduced by 27.5% over drusen compared with over a similar location in controls, and the finding of a difference was valid and significant (P=0.004). Photoreceptor outer segments were absent over at least 1 druse in 47% of eyes. Despite thinning of the PRL, inner retinal thickness remained unchanged. We observed 2 types of hyperreflective abnormalities in the neurosensory retina over drusen. Distinct hyperreflective speckled patterns occurred over drusen in 41% of AMD eyes and never in control eyes. A prominent hyperreflective haze was present in the photoreceptor nuclear layer over drusen in 67% of AMD eyes and more subtly in the photoreceptor nuclear layer in 18% of control eyes (no drusen).

Conclusions: With SD OCT as used in this study, we can easily detect and measure changes in PRL over drusen. Decreased PRL thickness over drusen suggests a degenerative process, with cell loss leading to decreased visual function. The hyperreflective foci overlying drusen are likely to represent progression of disease RPE cell migration into the retina and possible photoreceptor degeneration or glial scar formation. A longitudinal study using SD OCT to examine and measure the neurosensory retina over drusen will resolve the timeline of degenerative changes relative to druse formation.


Figures

Figure 1
Figure 1
An example of the high quality Spectral Domain Optical Coherence Tomography (SDOCT) images of the macula in a patient with age-related macular degeneration used for this study compared to the conventional time-domain OCT systems. Figure 1A. is a time-domain OCT (Stratus, Carl Zeiss Meditec, Dublin, CA) image, in which drusen area appears fuzzy. As shown in Fig. 1B, each individual image (B-scan) of the SDOCT system has a significantly higher spatial resolution and better noise characteristics than images from the conventional time-domain OCT system. The image quality can be further enhanced by registering and fusing a sequence of captured B-scans. The image shown in Fig. 1C is created by registering and averaging 12 raw SDOCT B-scans, with significantly higher signal to noise power ratio. The arrow in Fig. 1B shows the direction of image fusion (averaging).
Figure 2
Figure 2
Measuring the thickness of the retinal layers in eyes with age-related macular degeneration (AMD) and normal eyes. On each druse of the AMD eye of Fig. 2A, the druse height (including retinal pigment epithelium (RPE)), the photoreceptor layer (PRL) height, and the inner retina layer heights are marked with blue, green, and red lines (and arrows with matching color), respectively. Similar coloring scheme is used for the normal eye shown in Fig. 2B. Due to the absence of druse the blue line only represents the height of RPE layer in the control eye. Note the thinning of the PRL in Fig. 2A compared to Fig. 2B.
Figure 3
Figure 3
Following the layer definitions in Figure 2, three distinct layer areas were semi-automatically segmented using Amira software. Fig 3. A, and Fig 3. B show the segmented retinal pigment epithelium (RPE) and drusen (blue line), photoreceptor layer (green line), and inner retina (IR) layers (red line), in a subject with age-related macular degeneration and control eye, respectively. In this figure, we have only marked the outer borders of the photoreceptor layer, which is located between the RPE and IR layers.
Figure 4
Figure 4
The arrows in these spectral domain optical coherence tomography (SDOCT) B-Scans point to the sites of prominent diffuse hyper-reflective haze located over drusen in two different eyes (4A, 4B). In these eyes the haze extends over the non-foveal margin of the drusen. This haze was present over drusen in 67% of eyes.
Figure 4
Figure 4
The arrows in these spectral domain optical coherence tomography (SDOCT) B-Scans point to the sites of prominent diffuse hyper-reflective haze located over drusen in two different eyes (4A, 4B). In these eyes the haze extends over the non-foveal margin of the drusen. This haze was present over drusen in 67% of eyes.
Figure 5
Figure 5
Focal hyper-reflective speckling (arrows) was visible over and immediately adjacent to 41% of drusen and in none of the control images.
Figure 6
Figure 6
The photoreceptor layer (PRL) height (thickness) at drusen locations in age-related macular degeneration (AMD) eyes are compared to the corresponding values at similar distances from the center of the fovea in the controlled eyes. In almost all cases (97%), the PRL thickness in the AMD eyes (circles) was thinner than the healthy controlled eyes (curved line with error bars representing the 95% confidence interval).
Figure 7
Figure 7
Relation between drusen, height and width with respect to the change in photoreceptor layer (PRL) thickness is examined. The slope of the dashed-line, which represents the linear regression fit (described in Appendix B), is a measure of correlation between the change in PRL thickness and drusen height (or width). It is evident from these graphs that the effect of the drusen height in PRL thinning is more prominent than the effect of drusen width as illustrated in Fig. 7A and Fig. 7B, respectively.
Figure 7
Figure 7
Relation between drusen, height and width with respect to the change in photoreceptor layer (PRL) thickness is examined. The slope of the dashed-line, which represents the linear regression fit (described in Appendix B), is a measure of correlation between the change in PRL thickness and drusen height (or width). It is evident from these graphs that the effect of the drusen height in PRL thinning is more prominent than the effect of drusen width as illustrated in Fig. 7A and Fig. 7B, respectively.
Figure 8
Figure 8
The Inner Retinal height (thickness) measured at drusen locations in age-related macular degeneration (AMD) eyes are compared to the corresponding values at similar distances from the center of the fovea in the controlled eyes. The inner retinal (IR) thickness in AMD eyes (circles) is not significantly different than the healthy controlled eyes (curved line with error bars representing the 95% confidence interval).
Figure 9
Figure 9
Averaged measured total areas of the inner retinal (IR), photoreceptor layer (PRL), retinal pigment epithelial (RPE) layer in eyes of subjects with age-related macular degeneration and control eyes. Error bars represent the 95% confidence interval. Aside from the evident change in the RPE area, no significant change is seen on the averaged area of IR and PRL. This further confirms the importance of the local thickness change study in Fig. 6. AMD = age-related macular degeneration

References

    1. Klein R, Klein BE, Jensen SC, Meuer SM. The five-year incidence and progression of age-related maculopathy: the Beaver Dam Eye Study. Ophthalmology. 1997;104:7–21. - PubMed
    1. Mitchell P, Smith W, Attebo K, Wang JJ. Prevalence of age-related maculopathy in Australia: the Blue Mountains Eye Study. Ophthalmology. 1995;102:1450–60. - PubMed
    1. Rohrer B, Guo Y, Kunchithapautham K, Gilkeson GS. Eliminating complement factor D reduces photoreceptor susceptibility to light-induced damage. Invest Ophthalmol Vis Sci. 2007;48:5282–9. - PubMed
    1. Wong RW, Richa DC, Hahn P, et al. Iron toxicity as a potential factor in AMD. Retina. 2007;27:997–1003. - PubMed
    1. Pauleikhoff D, Barondes MJ, Minassian D, et al. Drusen as risk factors in age-related macular disease. Am J Ophthalmol. 1990;109:38–43. - PubMed

Publication types