. 2009 Jan;96(2):354-71.
doi: 10.1016/j.bpj.2008.09.041.

Thermal stability of apolipoprotein A-I in high-density lipoproteins by molecular dynamics

Affiliations

Thermal stability of apolipoprotein A-I in high-density lipoproteins by molecular dynamics

Martin K Jones et al. Biophys J. 2009 Jan.

Abstract

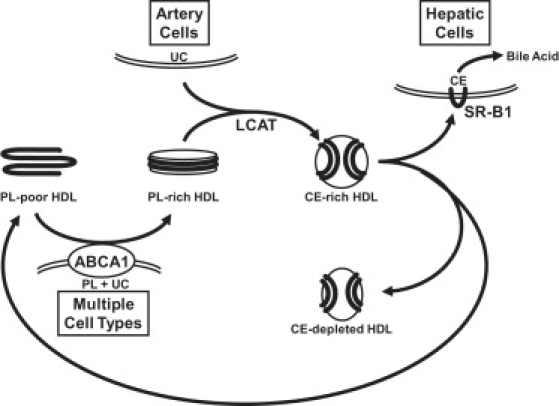
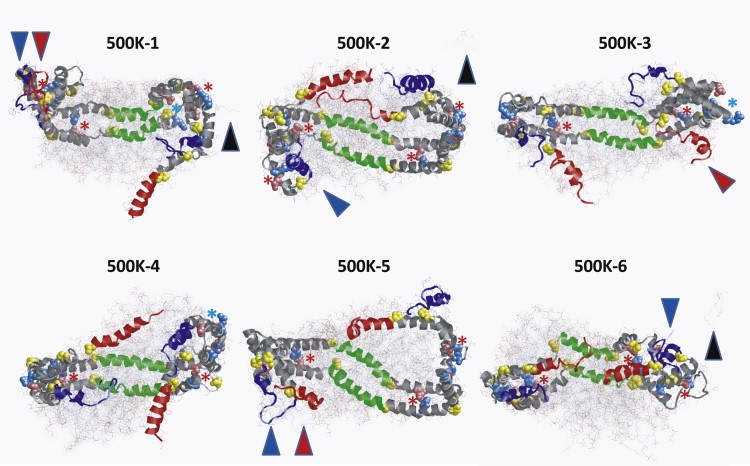
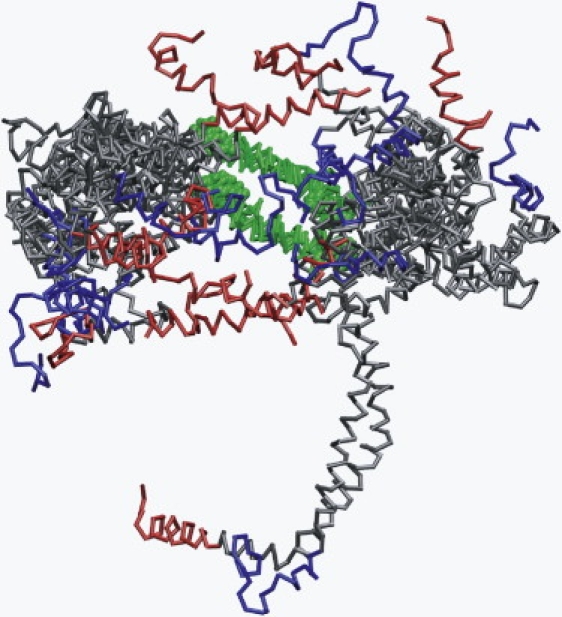
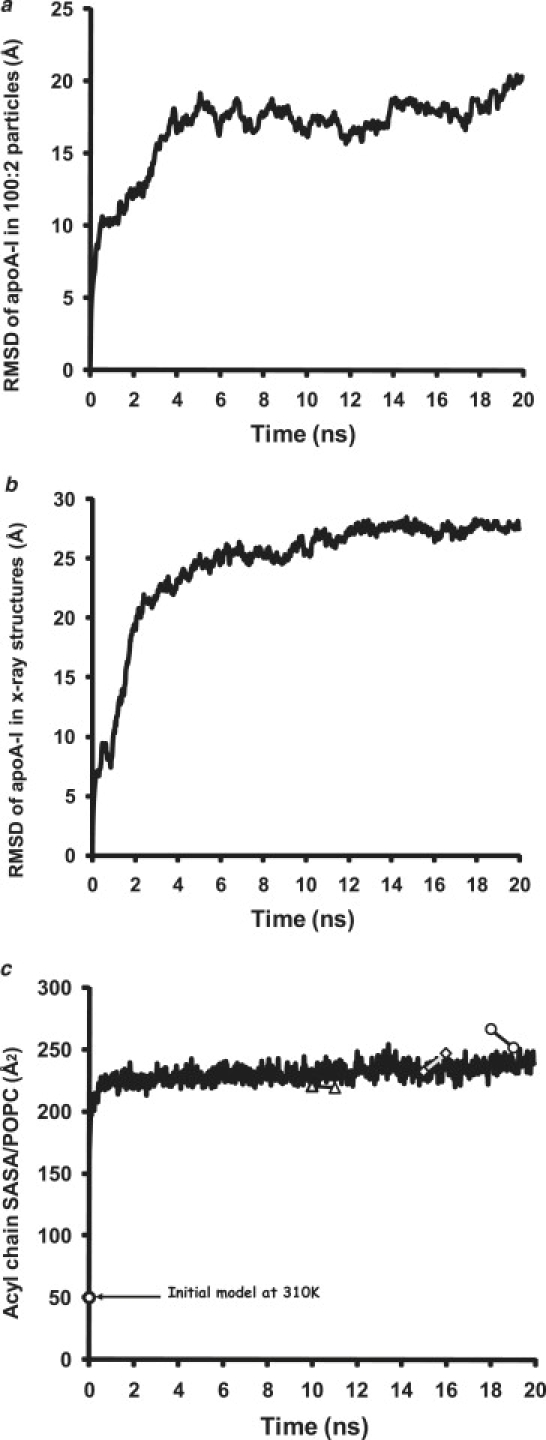
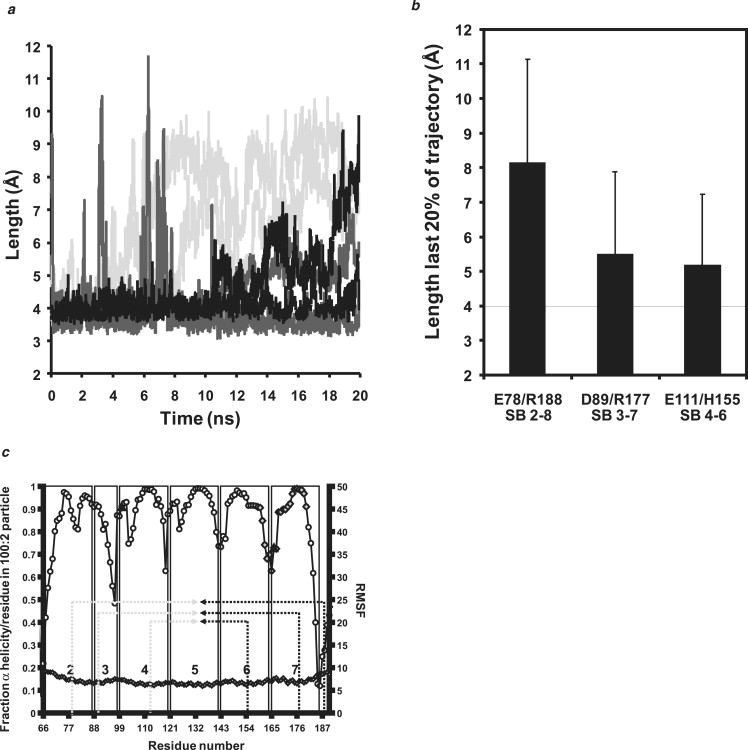
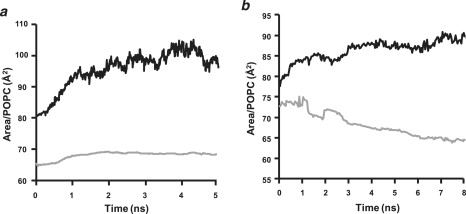
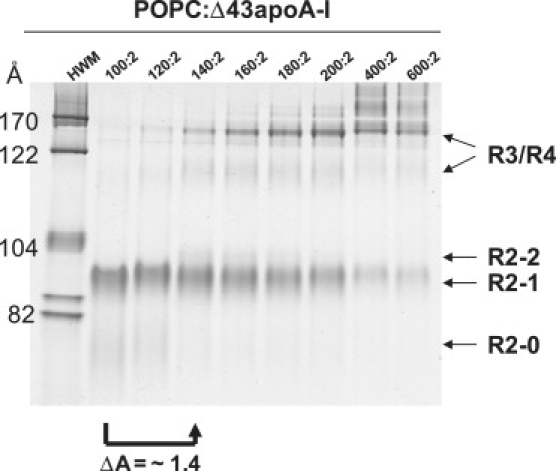
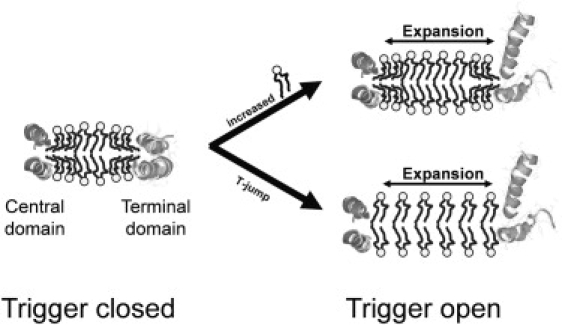
Apolipoprotein (apo) A-I is an unusually flexible protein whose lipid-associated structure is poorly understood. Thermal denaturation, which is used to measure the global helix stability of high-density lipoprotein (HDL)-associated apoA-I, provides no information about local helix stability. Here we report the use of temperature jump molecular dynamics (MD) simulations to scan the per-residue helix stability of apoA-I in phospholipid-rich HDL. When three 20 ns MD simulations were performed at 500 K on each of two particles created by MD simulations at 310 K, bilayers remained intact but expanded by 40%, and total apoA-I helicity decreased from 95% to 72%. Of significance, the conformations of the overlapping N- and C-terminal domains of apoA-I in the particles were unusually mobile, exposing hydrocarbon regions of the phospholipid to solvent; a lack of buried interhelical salt bridges in the terminal domains correlated with increased mobility. Nondenaturing gradient gels show that 40% expansion of the phospholipid surface of 100:2 particles by addition of palmitoyloleoylphosphatidylcholine exceeds the threshold of particle stability. As a unifying hypothesis, we propose that the terminal domains of apoA-I are phospholipid concentration-sensitive molecular triggers for fusion/remodeling of HDL particles. Since HDL remodeling is necessary for cholesterol transport, our model for remodeling has substantial biomedical implications.


Figures

Figure 1
Figure 1
Assembly of HDL during the process of reverse cholesterol transport.
Figure 2
Figure 2
Structures of each of the six 500 K simulations of 100:2 at 20 ns. 500 K-1–3: Three simulations of independent particle I-1. 500 K-4–6: Three simulations of independent particle I-2. Protein is in ribbon representation, except for prolines (yellow space-filling). POPC is in line representation with a van der Waals dot surface display. The structures are viewed from the terminal domain side of the particles with N-terminal helix 1 in blue and C-terminal helix 10 in red. Antiparallel helix-5 pairs in green are visible behind the POPC bilayer. The remainder of the protein is in gray. The black arrowheads denote the three desorbed POPC molecules; the red arrowheads and the blue arrowheads indicate where helix 10 and helix 1, respectively, form terminal interhelical hairpins. Potential salt bridges are indicated as space-filling images of the basic (sky blue) and acid (pink) residues. Pairs forming salt bridges are indicated by a red ; those not forming salt bridges are indicated by a pale blue .
Figure 3
Figure 3
Ensemble of all six 500 K 20 ns simulations aligned at helix 5. The structures are viewed from the terminal domain side of the particle. (Green) helix 5; (blue) N-terminal helix 1; (red) C-terminal helix 10.
Figure 4
Figure 4
Stability of 100:2 particles during six 20 ns MD simulations at 500 K. (a) Changes in average RMSD of the six 100:2 particle MD simulations at 500 K plotted over 20 ns. (b) Changes in average RMSD of the close AB and CD pairs of each of the two MD simulations performed on the control Δ40apoA-I structure at 500 K plotted over 20 ns. (c) Changes in average SASA of the acyl chains per POPC for the six 100:2 particle MD simulations at 500 K plotted over 20 ns; (white triangles, squares, and circles connected by line) changes in total SASA for each of the three simulations over the 1 ns before and after desorption of a single POPC molecule from its 100:2 particle.
Figure 5
Figure 5
POPC order parameters calculated for the last 40% of simulations at 310 K and 500 K for the average of the I-1 and I-2 particles versus a periodic bilayer. The values for the order parameters (Scd) are averages over both hydrogen atoms on each methylene carbon and are shown as triangles for the sn-1 (palmitoyl) chain and as circles for the sn-2 (oleoyl) chain. (a) Plot of (mean ± SE) order parameters over the last 40% of the first 10 ns of the simulations for I-1 and I-2. (b) Plot of the last 40% of the 310 K 5 ns simulation of a periodic bilayer containing 427 POPC. (c) Plot of (mean ± SE) order parameters calculated for all POPC within (open symbols) and not within (solid symbols) 6 Å of protein. SE bars are too small to see. (d) Plot of average order parameters for C14 calculated for all POPC within (open symbols) and not within (solid symbols) 6, 8, and 10 Å of protein. (e) Average of the last 40% of the six 20 ns 500 K MD simulations of the 100:2 particles. (f) Plot of the last 40% of the 500 K 5 ns simulation of a periodic bilayer containing 427 POPC.
Figure 6
Figure 6
RDF analyses of the COM of POPC molecules in periodic bilayer and 100:2 particles. (a) POPC COM-COM RDF analyzed for periodic bilayers over the last 20% of their 5 ns simulations at 310 K (open circles) and 500 K (solid circles). (Arrows) Approximate center of the 310 K and 500 K POPC RDF shells measured in Å. (b) POPC COM-COM RDF analyzed for 100:2 particles over the last 20% of their simulations at 310 K (open circles) and 500 K (solid circles). (Arrows) Approximate center of the major 310 K and 500 K POPC COM-COM RDF shells for each simulation measured in Å. (c) POPC COM-COM RDF analyzed for POPC of 100:2 particles subjected to 500 K T-jump: within 8 Å (open circles) or at >8 Å (solid circles) of protein annulus. (Arrows) Approximate center of the POPC COM-COM RDF shells of the two POPC populations measured in Å. (d) POPC COM-COM RDF analyzed for POPC of 100:2 particles simulated at 310 K within 6 Å (solid circles) or at >6 Å (open circles) of protein annulus. (Arrows) Approximate center of the POPC COM-COM RDF shells of the two POPC populations measured in Å.
Figure 7
Figure 7
ADF analyses of COM and phosphorus of POPC molecules in 100:2 particles and RDF analysis of salt bridge formation between nonbackbone nitrogens of protein basic residues and the phosphorus atoms of POPC. (a) ADF analysis of distance of COM of POPC from protein. (Gray line) Mean ADF of the six 100:2 particle MD simulations at 310 K averaged over the last 20% of the simulations. (Black line) Mean ADF of the six 100:2 particle MD simulations at 500 K averaged over the last 20% of the simulations. (b) ADF analysis of distance of POPC phosphorous atoms from protein. (Gray line) Mean ADF of the six 100:2 particle MD simulations at 310 K averaged over the last 20% of the simulations. (Black line) Mean ADF of the six 100:2 particle MD simulations at 500 K averaged over the last 20% of the simulations. (c) RDF analysis of distances between the nonbackbone nitrogens of protein basic residues (Lys, Arg, and His) and the phosphorus atoms of POPC for the 100:2 particles simulated at (gray line) 310 K and (black line) 500 K.
Figure 8
Figure 8
Local (per residue) changes in RMSF and fraction α-helicity during 20 ns MD simulations at 500 K for the six 100:2 particles versus the control Δ43apoA-I. The vertical boxes in each figure denote the positions of each of the 10 helical repeats. (a) Mean ± 1 SE in RMSF of the six 100:2 particle MD simulations at 500 K plotted over 20 ns. (b) Mean ± 1 SE in RMSF of the close AB and CD pairs of each of the two MD simulations performed on the control Δ40apoA-I structure at 500 K plotted over 20 ns. (c) Per-residue changes in fraction α-helicity (mean ± 1 SE) for the six 100:2 particle MD simulations for 20 ns at 500 K calculated from the last 20% of the trajectories. (d) Per-residue changes in fraction α-helicity (mean ± 1 SE) for the close AB and CD pairs of each of the two MD simulations performed on the control Δ40apoA-I structure for 20 ns at 500 K calculated from the last 20% of the trajectories.
Figure 9
Figure 9
Analyses of buried interhelical salt bridges for the six 100:2 particles during 20 ns MD simulations at 500 K. (a) Plot of distance between the six buried salt bridges with time of simulation. (Black lines) SB/E111–H155, SB/H155–E111. (Dark gray lines) SB/D89–R177, SB/R177–D89. (Light gray lines) SB/E78–R188, SB/R188–E78. (b) Bar graph plot of mean distance (mean ± 1 SD) between equivalent pairs of salt bridges over the full 20 ns of MD simulation. (c) Correlation of the position of the buried salt bridges to local helix thermal stability. A plot of the helix thermal stability of individual amino acid residues of the central portion of lipid-bound apoA-I (helixes 2–7) overlaid with the locations of the three pairs of buried salt bridges. (Black dashed arrows) Basic residues. (Gray dashed arrows) Acidic residues. (Gray diamonds) Residues 159–180, suggested by Wu et al. (43) on the basis of hydrogen-deuterium exchange, to form a protruding solvent-exposed loop that they propose directly interacts with and activates LCAT. (Black triangle) Tyr166, a preferred target for site-specific oxidative modification within atheroma according to Wu et al. (43).
Figure 10
Figure 10
Running time-averaged surface area per POPC in periodic bilayer and 100:2 particles measured by triangulation of POPC COM (see Materials and Methods). (a) Periodic bilayer. (Gray line) 310 K simulations. (Black line) 500 K simulations. The calculated area of expansion after T-jump MD simulations at 500 K is 1.51. (b) 100:2 particles. (Gray line) 310 K simulations. (Black line) 500 K simulations. The calculated area of expansion after T-jump MD simulations at 500 K is 1.4.
Figure 11
Figure 11
NDGGE analysis of POPC/Δ43apoA-I complexes at different POPC:protein ratios in 4–20% polyacrylamide gels run for 24 h. The arrow shows that expansion of the 100:2 particle by a factor of 1.4 through addition of POPC to produce a molar ratio of 140/2 POPC/Δ43apoA-I results in fusion of the R2-1 particle to produce larger particles in the 170 Å diameter range containing three to four Δ43apoA-I.
Figure 12
Figure 12
Schematic model of the terminal “trigger” domain hypothesis. PL molecules are represented schematically in the usual ball (light gray) and stick (black) motif. Particles are represented as bilayers in cross section. (Medium gray ribbon helixes) Terminal trigger domain. (Dark gray ribbon helixes) Central domain.

References

    1. Linsel-Nitschke P., Tall A.R. HDL as a target in the treatment of atherosclerotic cardiovascular disease. Nat. Rev. Drug Discov. 2005;4:193–205. - PubMed
    1. Oram J.F., Heinecke J.W. ATP-binding cassette transporter A1: a cell cholesterol exporter that protects against cardiovascular disease. Physiol. Rev. 2005;85:1343–1372. - PubMed
    1. Nichols A.V., Blanche P.J., Gong E.L., Shore V.G., Forte T.M. Molecular pathways in the transformation of model discoidal lipoprotein complexes induced by lecithin:cholesterol acyltransferase. Biochim. Biophys. Acta. 1985;834:285–300. - PubMed
    1. Trigatti B.L., Krieger M., Rigotti A. Influence of the HDL receptor SR-BI on lipoprotein metabolism and atherosclerosis. Arterioscler. Thromb. Vasc. Biol. 2003;23:1732–1738. - PubMed
    1. Rye K.A., Clay M.A., Barter P.J. Remodelling of high density lipoproteins by plasma factors. Atherosclerosis. 1999;145:227–238. - PubMed

Publication types