. 2009 Jan;96(2):485-98.
doi: 10.1016/j.bpj.2008.09.050.

Model development for the viral Kcv potassium channel

Affiliations

Model development for the viral Kcv potassium channel

Sascha Tayefeh et al. Biophys J. 2009 Jan.

Erratum in

  • Biophys J. 2011 Jan 5;100(1):270

Abstract

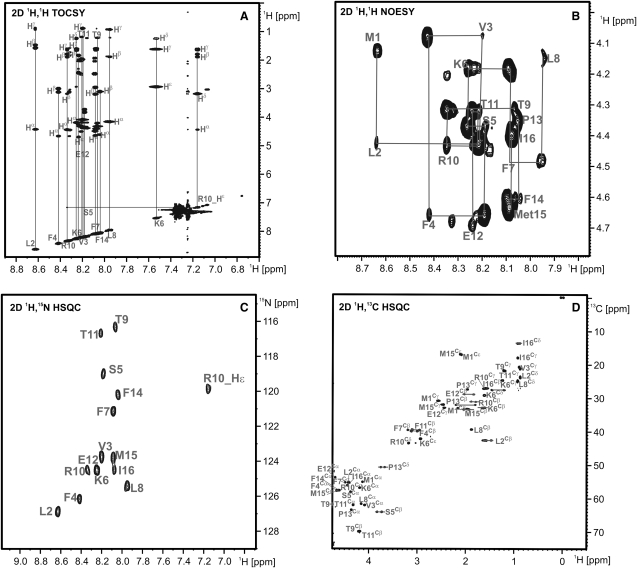
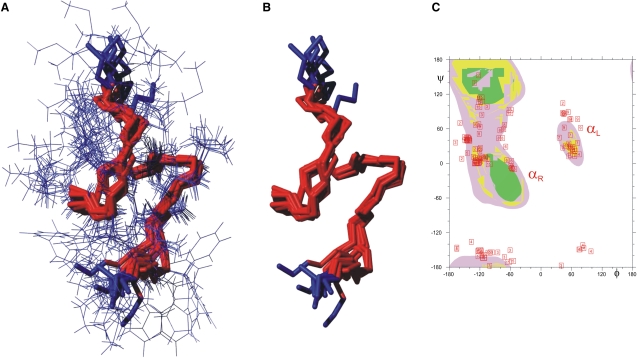
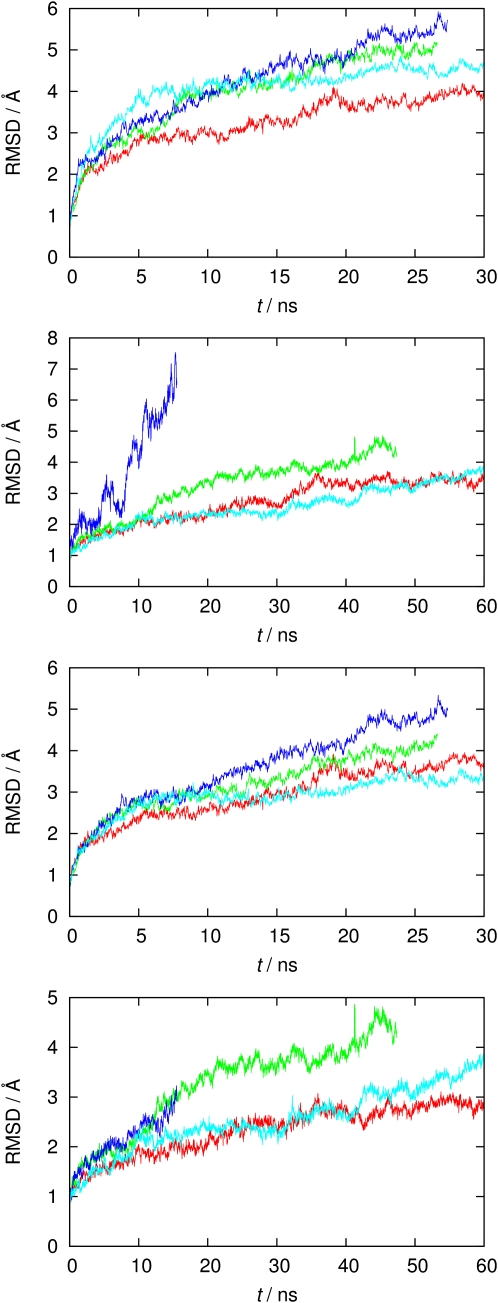
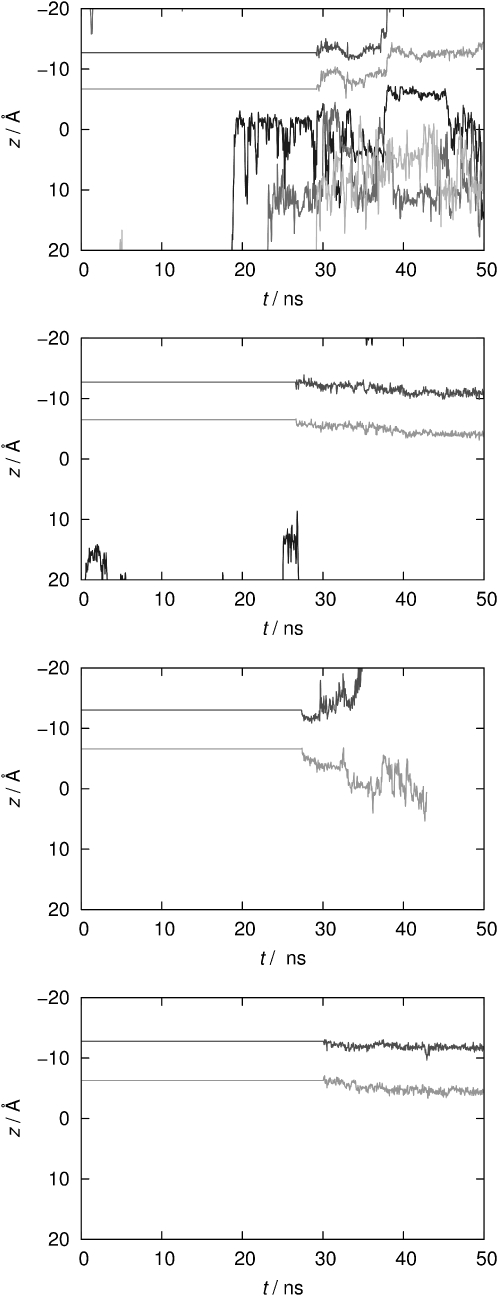
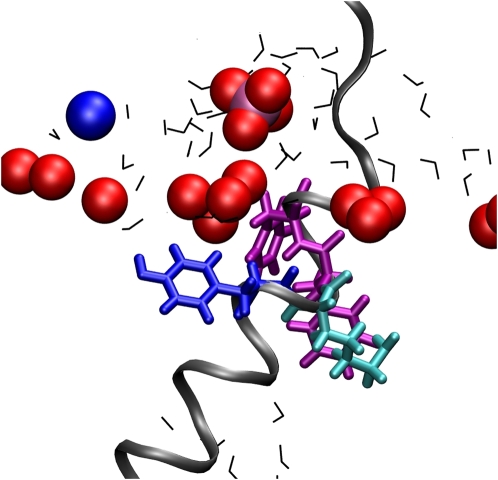
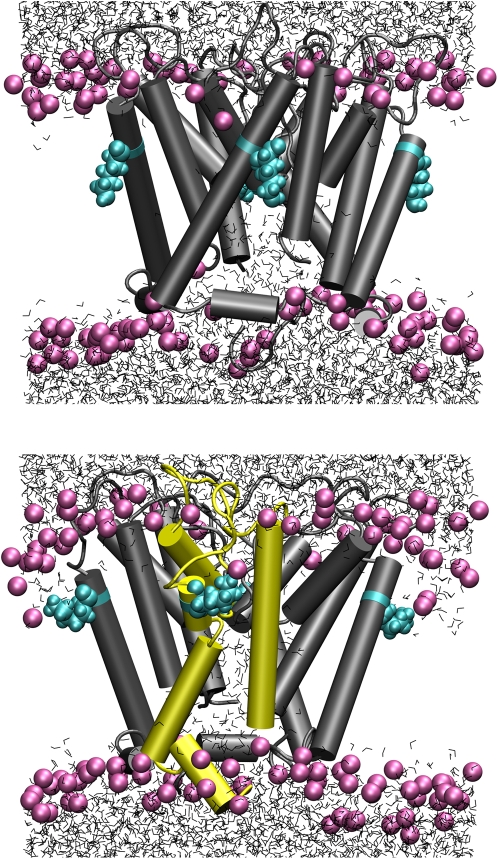
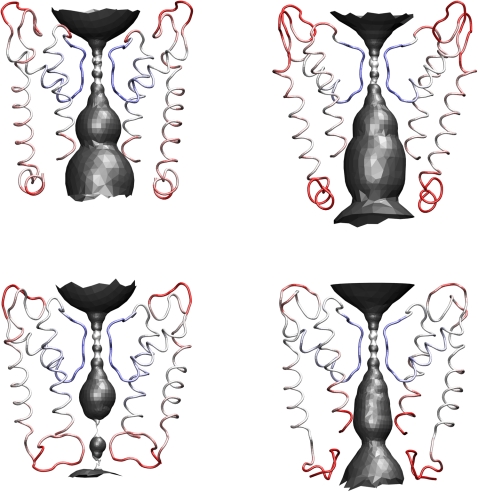
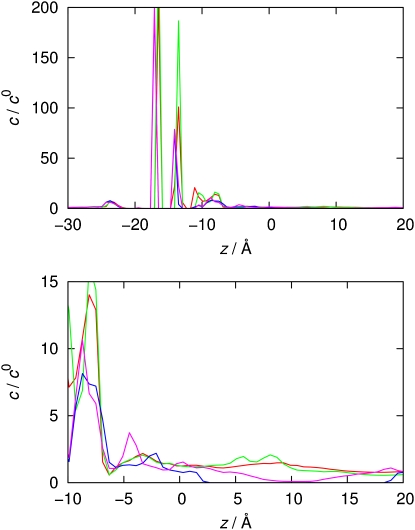
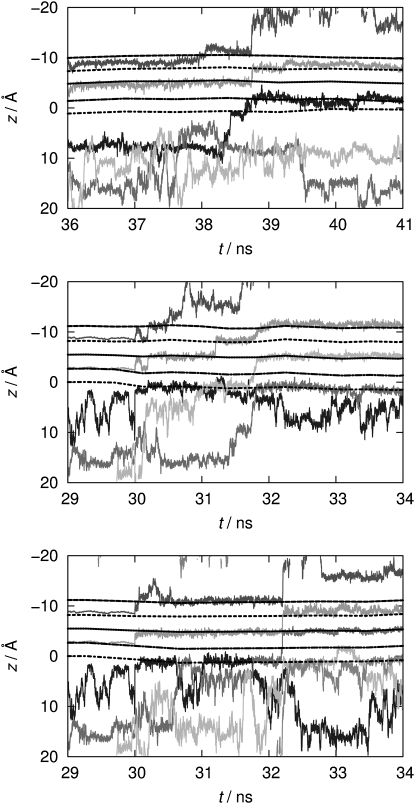
A computational model for the open state of the short viral Kcv potassium channel was created and tested based on homology modeling and extensive molecular-dynamics simulation in a membrane environment. Particular attention was paid to the structure of the highly flexible N-terminal region and to the protonation state of membrane-exposed lysine residues. Data from various experimental sources, NMR spectroscopy, and electrophysiology, as well as results from three-dimensional reference interaction site model integral equation theory were taken into account to select the most reasonable model among possible variants. The final model exhibits spontaneous ion transitions across the complete pore, with and without application of an external field. The nonequilibrium transport events could be induced reproducibly without abnormally large driving potential and without the need to place ions artificially at certain key positions along the transition path. The transport mechanism through the filter region corresponds to the classic view of single-file motion, which in our case is coupled to frequent exchange of ions between the innermost filter position and the cavity.


Figures

Figure 1
Figure 1
Alignment of Kcv with respect to KirBac1.1, used as input for 3D modeling.
Figure 2
Figure 2
NMR spectra recorded on the 16mer peptide at a temperature of 300 K at 600 MHz. (A) Assigned NH/aliphatic region in the 2D TOCSY with a mixing time of 80 ms. (B) Sequential resonance assignment walk in 2D NOESY with a mixing time of 300 ms. (C and D) Nitrogen and carbon HSQCs of the peptide with annotated resonance assignment.
Figure 3
Figure 3
(A and B) Overlay of the nine lowest-energy structures out of 100 calculated structures. (B) Only the backbone is shown. The RMSD value for all heavy atoms is ∼2 Å and 0.8 Å for the backbone atoms. (C) Ramachandran statistics for the nine lowest-energy structures.
Figure 4
Figure 4
Cα RMSD time series of the four variants (red: Kcv-HOM-K29deprot; green: Kcv-HOM-K29prot; cyan: Kcv-NMR-K29deprot; blue: Kcv-NMR-K29prot). From top to bottom: computed for all residues from rigid filter runs, subsequent fully flexible runs (time was reset to zero), computed for non-s-helix residues from rigid filter, and from fully flexible runs.
Figure 5
Figure 5
z coordinates (measured along the channel axis, intracellular mouth is located around z = 10 Å) of potassium ions over simulation time, from top to bottom: Kcv-HOM-K29deprot, Kcv-HOM-K29prot, Kcv-NMR-K29deprot, Kcv-NMR-K29prot. Only K+ ions that rested for more than 200 ps near the protein atoms are shown. Different shades of gray are used to distinguish ions.
Figure 6
Figure 6
Snapshot from the Kcv-HOM-K29deprot simulation showing the conformation of residues 28–31 (YKFF) in a single TM1. Only water and lipid atoms (N: blue; P: magenta; O: red) within a radius of 10 Å of the residues are shown. Blue sticks: Tyr28; cyan sticks: Lys29; magenta sticks: Phe30 and Phe31; gray ribbons: Kcv backbone; black lines: water.
Figure 7
Figure 7
Snapshots at t = 39 ns (i.e., 9 ns after filter constraints were removed), Kcv-HOM-K29deprot (top) and Kcv-HOM-K29prot (bottom). For lipids only P atoms are shown (magenta); Lys29: cyan; water: gray tubes; cylinders: α-helices as recognized by STRIDE (yellow tubes in bottom figure denote regions with the largest helix loss).
Figure 8
Figure 8
HOLE analysis and backbone atomic B factors (blue: <10 Å2; red: >20 Å2) mapped onto symmetrized average structures. Kcv-HOM-K29deprot (top left), Kcv-HOM-K29prot (top right), Kcv-NMR-K29deprot (bottom left), Kcv-NMR-K29prot (bottom right).
Figure 9
Figure 9
K+ concentration profiles along the pore axis from 3D-RISM theory for symmetrized average structures in c0 = 1 M KCl solution: Kcv-HOM-K29deprot (red), Kcv-HOM-K29prot (green), Kcv-NMR-K29deprot (blue), Kcv-NMR-K29prot (cyan). Top: View along the entire system. Bottom: Enlarged cavity and mouth region.
Figure 10
Figure 10
Current responses of HEK293 cells transfected with GFP: control (A), Kcv-wt (B), Kcv-K29L (C), and Kcv-K29A (D) to standard voltage protocol from holding voltage (0 mV) to test voltages between +60 mV and −160 mV. (E) Steady-state I/V relations of currents in A–D; symbols cross-reference with symbols in A–D. (F) Percentage of transfected HEK293 cells with Kcv conductance, for Kcv-wt and mutants; the number of recordings is indicated in brackets.
Figure 11
Figure 11
z coordinates (measured along the channel axis) of potassium ions over 6 ns simulation time for flexible filter runs of Kcv-HOM-K29deprot, from top to bottom: without external field (enlarged view of top panel of Fig. 5), simulations E1 and E2 with constant external field corresponding to +100 mV voltage. Dashed/dotted lines show the positions of binding sites S0–S4 (from top to bottom). The positions were defined as the geometric center of the oxygen rings of two adjacent filter residues (62–67). Different shades of gray are used to distinguish ions.

References

    1. Gazzarrini S., Severino M., Lombardi M., Morandi M., DiFrancesco D. The viral potassium channel Kcv: structural and functional features. FEBS Lett. 2003;552:12–16. - PubMed
    1. Plugge B., Gazzarrini S., Nelson M., Cerana R., Van Etten J.L. A potassium channel protein encoded by chlorella virus PBCV-1. Science. 2000;287:1641–1644. - PubMed
    1. Berneche S., Roux B. Molecular dynamics of the KcsA K+ channel in a bilayer membrane. Biophys. J. 2000;78:2900–2917. - PMC - PubMed
    1. Allen T.W., Kuyucak S., Chung S.H. Molecular dynamics study of the KcsA potassium channel. Biophys. J. 1999;77:2502–2516. - PMC - PubMed
    1. Domene C., Grottesi A., Sansom M.S.P. Filter flexibility and distortion in a bacterial inward rectifier K+ channel: simulation studies of KirBac1.1. Biophys. J. 2004;87:256–267. - PMC - PubMed

Publication types

LinkOut - more resources