. 2009 Jan 23;136(2):337-51.
doi: 10.1016/j.cell.2008.11.051.

Digital signaling and hysteresis characterize ras activation in lymphoid cells

Affiliations

Digital signaling and hysteresis characterize ras activation in lymphoid cells

Jayajit Das et al. Cell. .

Abstract

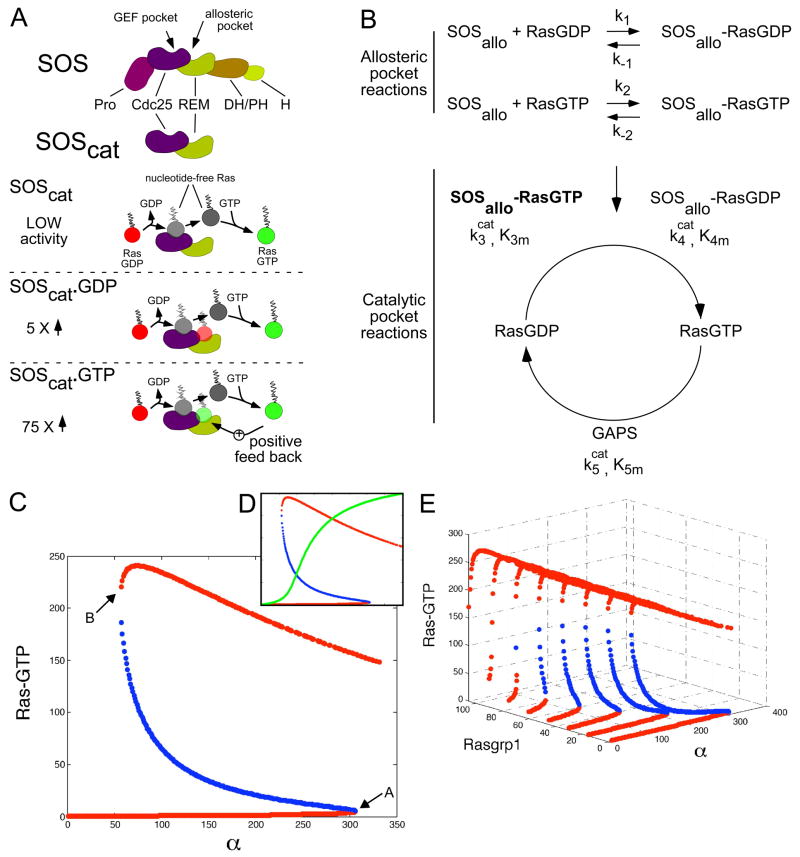
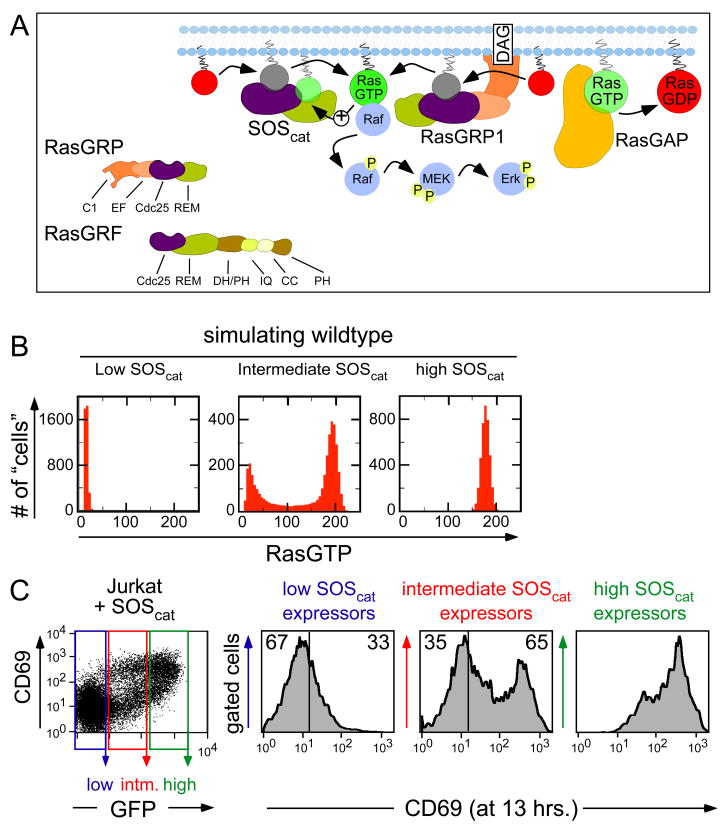
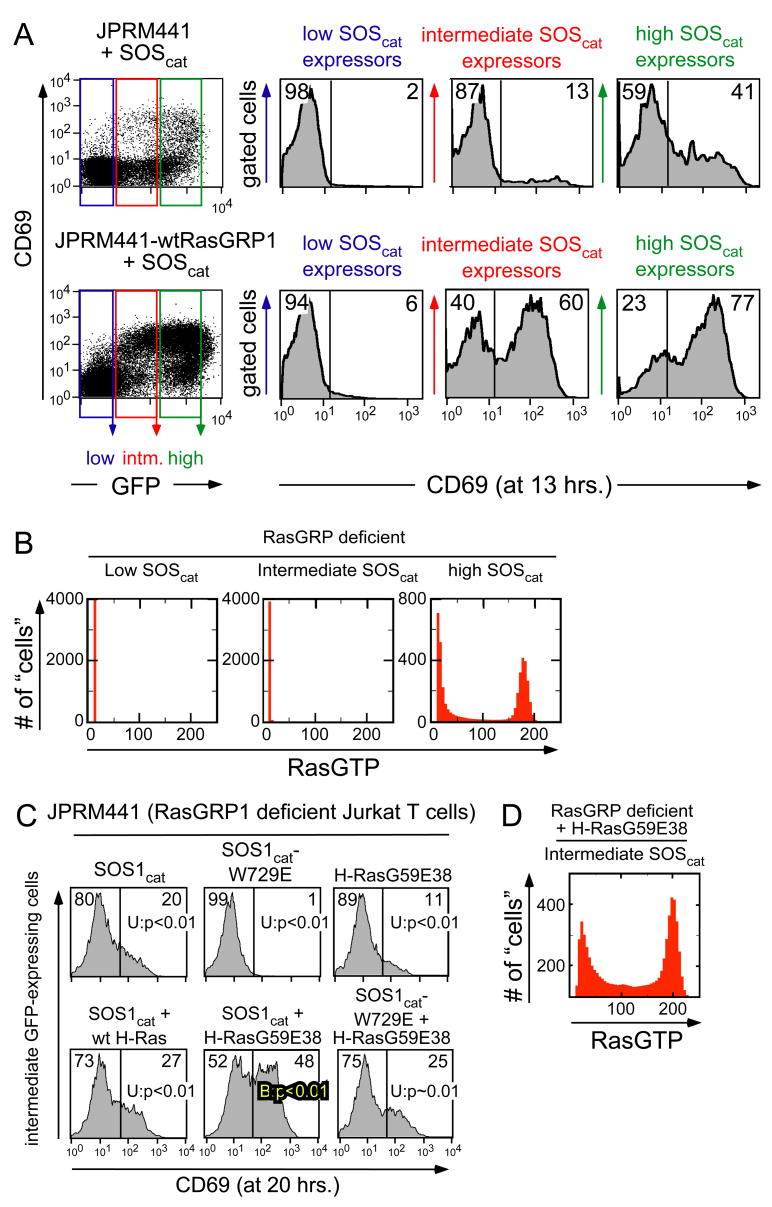
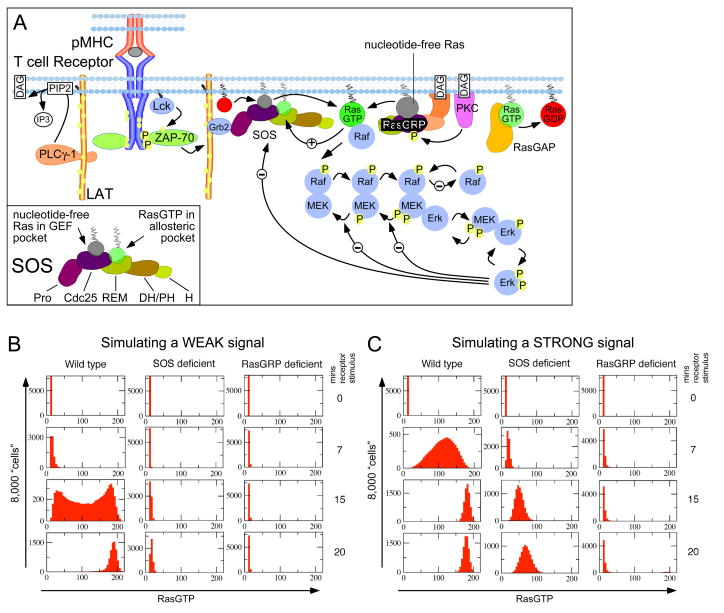
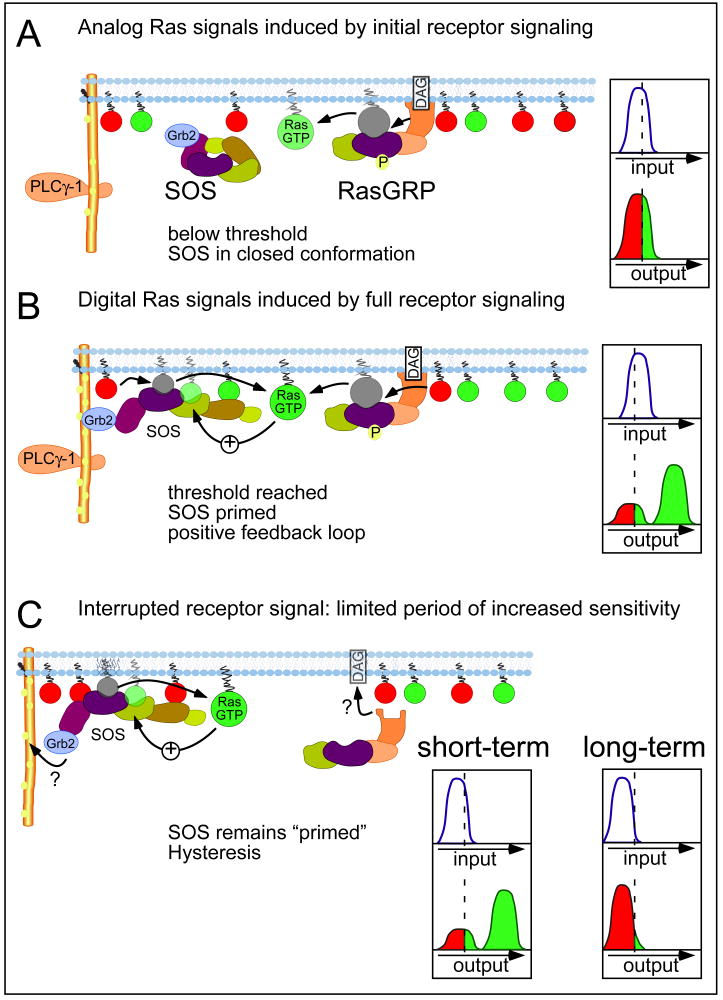
Activation of Ras proteins underlies functional decisions in diverse cell types. Two molecules, RasGRP and SOS, catalyze Ras activation in lymphocytes. Binding of active Ras to SOS' allosteric pocket markedly increases SOS' activity establishing a positive feedback loop for SOS-mediated Ras activation. Integrating in silico and in vitro studies, we demonstrate that digital signaling in lymphocytes (cells are "on" or "off") is predicated upon feedback regulation of SOS. SOS' feedback loop leads to hysteresis in the dose-response curve, which can enable a capacity to sustain Ras activation as stimuli are withdrawn and exhibit "memory" of past encounters with antigen. Ras activation via RasGRP alone is analog (graded increase in amplitude with stimulus). We describe how complementary analog (RasGRP) and digital (SOS) pathways act on Ras to efficiently convert analog input to digital output. Numerous predictions regarding the impact of our findings on lymphocyte function and development are noted.


Figures

Figure 1
Figure 1. A minimal model of the catalytic domain of SOS predicts three possible states of Ras activation
(A) SOS′ protein domains, GEF pocket, and allosteric pocket. Pro = proline-rich, Cdc25 = Cdc25 homology domain, REM = Ras exchange motif, DH/PH = Dbl-homology, Pleckstrin-homology domain, H = Histone folds. SOScat includes the catalytic region which contains both the GEF and the allosteric pockets. Illustration of SOScat’s mode of Ras activation. Note that binding of RasGTP to the allosteric pocket increases SOScat’s activity 75 fold, establishing a positive feedback loop. (B) Depiction of the allosteric pocket and catalytic site reactions on SOScat. SOSallo-Ras-GTP in bold reflects the 75 fold increased catalytic activity. (C) Steady states of the mean-field kinetic rate equations show production of low and high concentrations of RasGTP (characterized by stable fixed points in red) at low and high values of α. α represents the total number of SOScat molecules in the simulation box (see Supplement, Section I). At intermediate levels of α, three states arise with unstable fixed Ras-GTP points shown in blue. (D) Overlay with analysis in 1C. The green line represents simulations when the allosteric pocket of SOScat is mutated in a way that it cannot bind to Ras-GDP or Ras-GTP. In order to demonstrate the overlay in the same graph, the low catalytic rate (kcat ~0.0005 s−1) of the mutant SOScat was artificially increased to 0.038s−1. (E) Steady state activation of Ras-GTP as a function of SOScat and RasGRP. The RasGRP-DAG complex (abbreviated RasGRP) catalyzes Ras-GDP following the reactions shown in reaction #8 in Table S4. This reaction is incorporated in the ODE model: k8f[RasGRPDAG][RasGDP]/(K8m+[RasGDP]), in Eq.(1c) with k8f=0.01s1 and K8m = 3.06 μM, calculated from Table S4. Unstable and stable points are shown in blue and red respectively.
Figure 2
Figure 2. Bimodal Ras activation induced by SOScat operating in the Ras signaling network occurs in a stochastic model and in a T cell line
(A) Representation of SOScat function in the context of the Ras signaling network. Besides SOS-1 and -2, lymphocytes express the RasGEFs RasGRP-1 and -3 and RasGRF2. C1 = DAG-binding C1 domain, EF = calcium-binding EF hand. IQ = motif for calcium/calmodulin binding, CC = coiled coil. RasGTP produced by RasGRP1 can influence SOS′ activity via the allosteric pocket. Of note, deficiency of RasGRF2 does not appear to impact T cell Ras activation but influences the calcium-NFAT pathway (Ruiz et al., 2007). (B) Distributions of RasGTP calculated from our stochastic simulation algorithm at low, intermediate, or high levels of SOScat (2 fold increments) in a wild type “cell”. At intermediate levels of SOScat a bimodal RasGTP pattern arises. See Section II (Tables S4-S8, Figures S5-S12) for additional information. (C) Introduction of intermediate levels of SOS1cat into a wildtype Jurkat T cell line leads to bimodal upregulation of CD69. Cells were cotransfected with ten μg of GFP- and ten μg of SOS1cat -expressing plasmid. The dot plot depicts CD69 and GFP expression on individual cells, analyzed by FACS. Electronic gates define low, medium, and high GFP expression, reflecting low, medium, and high expression of the co-transfected SOS1cat plasmid. CD69 expression was analyzed in histograms for the three different gates. See Figure S21B for protein expression levels. 2C is a representative example of three independent experiments.
Figure 3
Figure 3. A RasGTP mimetic restores efficient SOScat –induced bimodal signals in RasGRP deficient cells
(A) Analysis of the efficiency of SOScat -induced Ras signaling in a RasGRP1-deficient Jurkat T cell line (JPRM441) and its wildtype RasGRP1-reconstituted derivative line (JPRM441-wtRasGRP1). Experimentation and analysis as in figure 2C, see also Figure S21B. Intermediate SOScat induces high levels of CD69 expression in only 13% of the JPRM441 cells. This relative defect in JPRM441 cells is restored to 60% in the JPRM441-wtRasGRP1 cells. (B) Stochastic simulations as in 2B. Histograms of Ras-GTP simulating a RasGRP deficient state are depicted. Increments of SOScat between the plots are 2 fold. Note the lack of a bimodal distribution in “cells” with intermediate SOScat. (C) Introduction of a RasGTP mimetic overcomes RasGRP1 deficiency in JPRM441 cells. JPRM441 cells were transfected with GFP together with SOScat, SOScat –W729E (allosteric pocket mutant), H-RasG59E38 (RasGTP mimetic), H-Ras, or combinations thereof. CD69 expression was analyzed by FACS and depicted as histograms for the intermediate GFP-expressing cells. Histograms were subsequently analyzed by a Hartigan’s statistical test to examine uni- versus bi-modality. See figure S24. H-RasG59E38 synergizes with SOScat to produce a bimodal pattern (Hartigan’s test; B:p<0.01), but not with SOScat -W729E. For detailed description and expression levels of introduced proteins see figure S23. Figure 3C is representative of results in three independent experiments. (D) Stochastic simulations introducing a H-RasG59E38 molecule into the mathematical model. Note the reappearance of a bimodal response in “cells” with intermediate SOScat.., compared to Figure 3B.
Figure 4
Figure 4. Digital antigen receptor induced Ras activation in silico
(A) Representation of the Ras signaling network in T lymphocytes that is simulated by our stochastic simulation algorithm. Lck phosphorylates TCRζ leading to recruitment of ZAP-70. ZAP-70 phosphorylates LAT resulting in the recruitment of Grb2-SOS and PLCγ1. DAG produced by PLCγ1 leads to phosphorylation of RasGRP1 by PKCθ. Both SOS and RasGRP produce RasGTP signaling downstream to RAF, MEK, and ERK. B lymphocytes express PLCγ2 and downstream signaling events are very similar to those in T lymphocytes. (B) Ras activation in 8,000 “cells” in simulation induced by weak receptor signals over time. A bimodal RasGTP pattern emerges in wildtype, but not SOS or RasGRP deficient states. (C) Same as in (B) but simulating strong receptor signals. RasGTP levels rapidly increase in the wildtype “cells”. A graded increase in RasGTP is observed in the SOS deficient system. See supplement, Section III (Tables S9–S13, Figures S13–S20) for additional information, parameters, and parameter variation tests.
Figure 5
Figure 5. RasGRP induces analog phospho-ERK signals, whilst SOS induces digital signals in B cell lines and primary T cells
(A) Fluorescence flow cytometric analysis of ERK phosphorylation in 20,000 individual Jurkat T cells per histogram. Cells were stimulated for the indicated time intervals with a TCR stimulating antibody (1:500 dilution of C305). ERK phosphorylation initially occurs in a unimodal fashion and switches to a bimodal pattern (Hartigan’s tests). Numbers inside the histograms represent the percentage of cells on either side of the divider. (B) As in (A) but cells were stimulated with 25 ng/ml PMA (a DAG analog) for shorter time intervals. Note the gradual increase of phospho-ERK over time without bimodal patterns. (C) The indicated DT40 B cell lines were weakly or strongly stimulated through their BCR for 3, 10, or 30 minutes, or left unstimulated. “U” or “B” labels indicate unimodal or bimodal (Hartigan test). See figure S24 for methods, additional data and p-values. (D) Same as in (C), except cells were stimulated with PMA; either weak (10 ng/ml) or strong (60 ng/ml). See figure S25 for additional data. (E, F) Digital, TCR-induced, ERK phosphorylation in CD4 positive lymph node T cells, but analog PMA-induced ERK phosphorylation. Cells were stimulated by crosslinking their TCR in (E) or by PMA in (F). Figures 5A-F are representative examples of 2, 3, 3, 2, 3, and 2 independent experiments, respectively.
Figure 6
Figure 6. Hysteresis at the level of RasGTP depends on SOS
(A) Prediction of hysteresis in Ras activation from our stochastic simulation. Points in black and red denote Ras activations at a time t=10 minutes when the cells had either 0 or 62 molecules/(μm)2 of Ras-GTP concentrations at t=0 minutes, respectively. All the simulations are done with a fixed RasGRP1 concentration at 500 molecules/(μm)3. (B) Cartoon illustrating about the biochemical origin of hysteresis: a low level of remaining RasGTP that can can bind the allosteric pocket in SOS. (C–F) Analysis of GTP loaded Ras using pull-down assays. Lanes 3–6: cells stimulated for 3 minutes in the presence of increasing amounts of PP2 (Src kinase inhibitor) added simultaneously with the stimulus at t=0. Alternatively (lanes 8–11), cells were stimulated for 3 minutes, inhibitor was introduced at t=3 minutes, and responses were analyzed at 7 minutes. Lane 1 is unstimulated, lanes 2 and 7 have no inhibitor added. Legend of the panels: (C) Jurkat T cells and (D) Jurkat T cells preloaded with U0126 MEK1/2 inhibitor both stimulated with 1:500 diluted C305 (α-TCR), (E) wildtype DT40 B cells and (F) SOS1−/−SOS2−/− doubly deficient DT40 B cells both stimulated with 1:300 diluted M4 (α-BCR). Experiments presented in 6C–F are representative examples of 3, 4, 5, and 3 independent experiments, respectively. Numbers indicate pixel intensity of the corresponding RasGTP, corrected for total Ras, one condition arbitrarily set at 100%. Due to a suboptimal blot transfer in 6D, 13%* and 38%* are under-representations of the level of generated RasGTP. (G) Modeling serial stimulation. RasGTP (blue line) was initially induced by high levels of SOScat (black box, 350 molecules α). SOScat was removed for 100, 250, or 500 seconds and subsequent low level SOScat signals were simulated (green box, 150 molecules α). Provided that RasGTP levels do not fall below the blue points (Figure 1C), robust re-stimulation is induced by low level SOScat. The results are obtained from mean field rate equations corresponding to the pathway in Fig 1B and the parameters in Table 1. (H) Lack of sensitized re-stimulation in the absence of SOS. The model from figure 1E is used to analyze a SOS deficient state in the same manner as Fig. 6G. RasGRP1 values were set at 100 (black) and 50 (green) molecules of RasGRP1 in the simulation box, respectively. The response to the second stimulus is history-independent. (I) Experimental design to mimic serial stimulation of lymphocytes. (J) Concanavilin A (ConA) induces RasGTP in wildtype DT40 and SOS1−/−SOS2−/−deficient DT40 B cells. α-methyl mannoside (α-MM) is added at t=3 minutes to stop the ConA-induced BCR stimulus (Weiss et al., 1987) and RasGTP levels decrease to slightly above basal levels at t=12 minutes. (K) Previous RasGTP induction by ConA stimulation of wildtype DT40 B cells followed by α-MM results in very sensitive induction of RasGTP by a second minimal BCR stimulus (1:4,500 diluted M4; 1/15th of the amount in 6E and F), whereas priming with PBS as negative control does not. (L) Induction of RasGTP by ConA in SOS1−/−SOS2−/− deficient DT40 B cells does not result in sensitive RasGTP generation by a second signal (1:3,000 diluted M4; α-BCR). Experiments presented in 6J-L are representative examples of 3, 4, and 2 independent experiments, respectively
Figure 7
Figure 7. Model of analog and digital signaling and hysteresis in lymphocytes
(A) Upon initial receptor activation analog Ras signals are generated in lymphocytes because Ras activation occurs solely via RasGRP. Inset: a small graded increase in signal input results in relatively low Ras output in an analog manner. (B) Inset: once a certain threshold in the analog receptor activation is surpassed, the output is characterized by digital Ras signals. Digital signals originate in the positive feedback loop that involves the allosteric pocket of SOS, initially primed by RasGTP coming from RasGRP, subsequently from both RasGRP and SOS. (C) Previously stimulated cells maintain a limited period of increased sensitivity to activate Ras. The short-term hysteresis is caused by the low levels of RasGTP that remain but are potent in engaging the allosteric feedback loop. Inset: short-term hysteresis provides a level of “signaling memory” in that a mild second signal can evoke a strong digital response because SOS molecules remain primed. However, hysteresis is limited and is lost long-term. The mechanisms of biochemical recruitment/retention of Grb2/SOS or RasGRP during hysteresis are unknown.

References

    1. Altan-Bonnet G, Germain RN. Modeling T cell antigen discrimination based on feedback control of digital ERK responses. PLoS Biol. 2005;3:e356. - PMC - PubMed
    1. Barkai N, Leibler S. Circadian clocks limited by noise. Nature. 2000;403:267–268. - PubMed
    1. Bhalla US, Iyengar R. Emergent properties of networks of biological signaling pathways. Science. 1999;283:381–387. - PubMed
    1. Bortz BKMH, Lebowitz JL. Journal of Computational Physics. 1975;17
    1. Bousso P, Robey E. Dynamics of CD8(+) T cell priming by dendritic cells in intact lymph nodes. Nature immunology. 2003;4:579–585. - PubMed

Publication types