. 2009 Jan 23;136(2):364-77.
doi: 10.1016/j.cell.2009.01.001.

Role of the murine reprogramming factors in the induction of pluripotency

Affiliations

Role of the murine reprogramming factors in the induction of pluripotency

Rupa Sridharan et al. Cell. .

Abstract

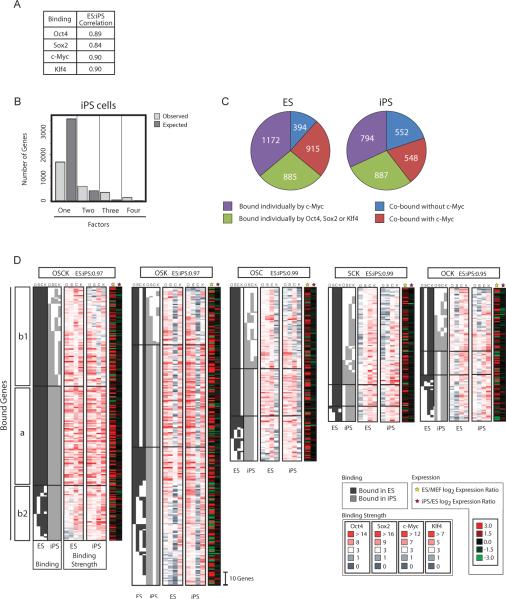
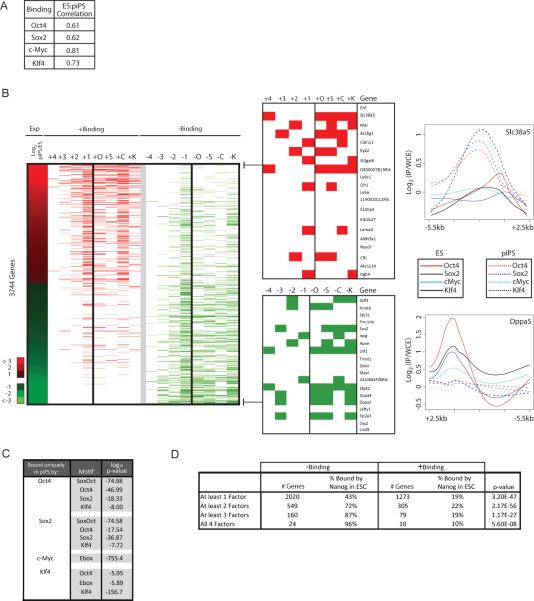
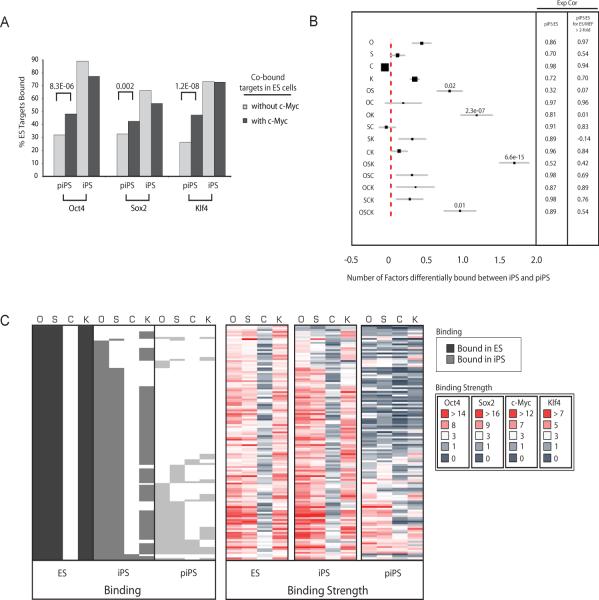
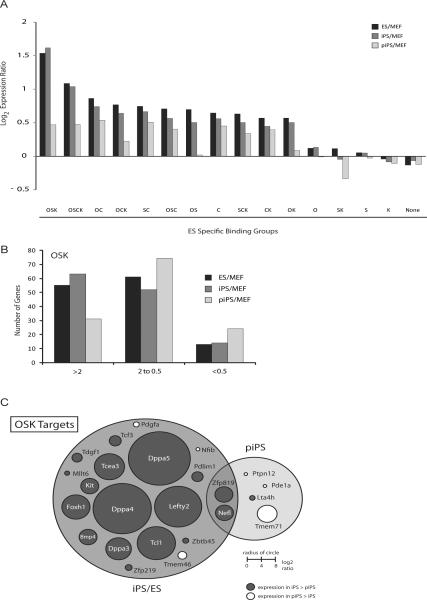
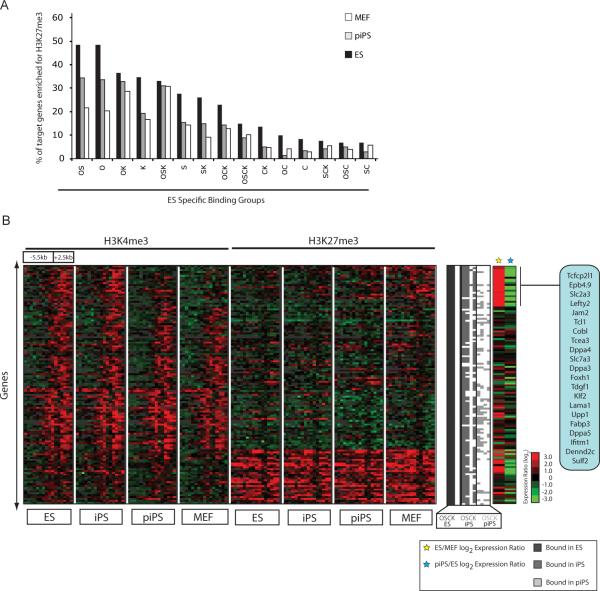
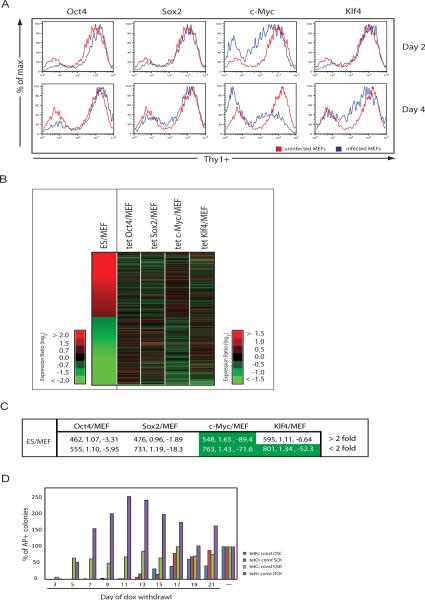
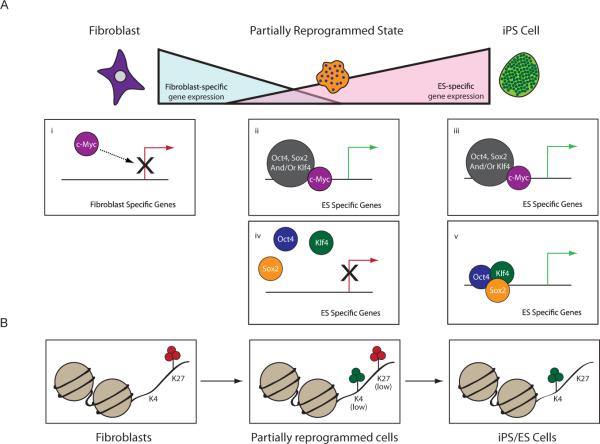
Induced pluripotent stem (iPS) cells can be obtained from fibroblasts upon expression of Oct4, Sox2, Klf4, and c-Myc. To understand how these factors induce pluripotency, we carried out genome-wide analyses of their promoter binding and expression in iPS and partially reprogrammed cells. We find that target genes of the four factors strongly overlap in iPS and embryonic stem (ES) cells. In partially reprogrammed cells, many genes co-occupied by c-Myc and any of the other three factors already show an ES cell-like binding and expression pattern. In contrast, genes that are specifically co-bound by Oct4, Sox2, and Klf4 in ES cells and encode pluripotency regulators severely lack binding and transcriptional activation. Among the four factors, c-Myc promotes the most ES cell-like transcription pattern when expressed individually in fibroblasts. These data uncover temporal and separable contributions of the four factors during the reprogramming process and indicate that ectopic c-Myc predominantly acts before pluripotency regulators are activated.


Figures

Figure 1
Figure 1. Target overlap between ES and iPS cells
(A) Pearson correlation of binding strength at the probe level for each factor between iPS and ES cells across all genes. (B) Bar chart indicates the number of genes observed to be bound by only one, any combination of two or three, and all four factors in iPS cells (light grey) and the expected number of target genes calculated assuming that each factor binds independently of the others (dark grey). (C) Pie charts indicate the number and proportion of target genes bound by single or multiple factors in iPS or ES cells, divided according to the presence of c-Myc. (D) Comparison of binding patterns in ES and iPS cells for genes bound by the indicated combination of three or four factors (denoted by single letter nomenclature with O=Oct4, S=Sox2, C=c-Myc, and K=Klf4), The three segments of each cluster are based on the overlap of binding events between ES and iPS cells: section (a) depicts genes bound by the same set of factors in ES and iPS cells, (b1) and (b2) contain genes that have binding by additional and/or fewer factors in either cell type. Binding of a gene is marked by a dark (ES) or light grey block (iPS). Heat maps plot the corresponding binding strength. For each factor, the lowest maximum binding strength among all genes and cell types analyzed in this study was set to the darkest red color. For each binding cluster, expression ratios ES cells/fibroblasts (MEFs) (yellow star) and iPS/ES cells (red star) and the Pearson correlation coefficient comparing expression of the genes within a cluster between ES and iPS cells are given (top).
Figure 2
Figure 2. Differential binding between partially reprogrammed cells and ES cells correlates with expression differences
(A) Pearson correlation of binding strength at the probe level for each factor between ES cells and partially reprogrammed cells across all genes. (B) The heat map in the Exp column depicts the log2 expression ratio between partially reprogrammed cells (piPS) and ES cells for genes more than two-fold differentially expressed between these cell types. For these genes, +Binding columns illustrate binding events in partially reprogrammed cells that were not found in ES cells (in red); with +1 to +4 indicating the number of factors that were bound in partially reprogrammed cells but not in ES cells and the letter indicating the factor (Oct4 (+O), Klf4 (+K), Sox2 (+S), or c-Myc (+C)). Similarly, in −Binding columns, genes that were bound in ES cells but not in partially reprogrammed cells are marked in green; with −1 to −4 indicating the number of factors that were bound in ES cells and not in partially reprogrammed cells and the letter indicating the factor. Binding differences for the most differentially expressed genes between ES and partially reprogrammed cells are presented in a zoomed view to the right and graphs to the far right plot log2(IP/input) ratios of probes over the 8kb promoter region for one gene from each subgroup. (C) For binding events found in partially reprogrammed cells but not ES cells, bound regions were scanned for the presence of the DNA binding motifs of the four factors (with the Ebox motif being bound by c-Myc). Significantly enriched motifs are indicated. (D) Genes bound by fewer factors in partially reprogrammed cells than ES cells (− Binding) or by more factors (+ Binding) were divided according to the number of factors differentially bound between these cell types. The number of genes per group and the fraction of these genes that is bound by Nanog in ES cells are presented. Significance was computed using the difference of proportions test.
Figure 3
Figure 3. OSK targets are most differentially bound between iPS cells and partially reprogrammed cells
(A) Genes bound by two, three or four factors in ES cells were divided into those co-occupied by c-Myc and those lacking c-Myc. For both groups of genes, the bar plot presents the fraction of Oct4, Sox2 or Klf4 ES targets that are bound by the respective factor in partially reprogrammed cells (piPS) or iPS cells. Significant differences for binding in piPS, computed using the difference of proportions test, are indicated. (B) The graph displays the average number of factors differentially bound between iPS and partially reprogrammed cells for target genes grouped according to their factor association in ES cells (given to the left), within a 95% confidence interval. Filled squares reflect the relative number of genes in each target group. Significance was determined using the binomial distribution. Pearson correlation coefficients (Exp Cor) for expression between ES and partially reprogrammed cells (piPS) were computed for genes in each group and for those genes in a given group that are expressed at least two-fold higher in ES cells compared to MEFs. (C) Binding calls and binding strength heatmaps of Oct4, Sox2, c-Myc and Klf4 in ES cells, iPS cells and partially reprogrammed cells (piPS, lightest grey) for OSK ES targets as described in Fig 1D.
Figure 4
Figure 4. OSK targets are most differentially expressed between ES/iPS cells and partially reprogrammed cells
(A) Bar chart depicting the mean of the log2 expression ratio between the ES (black), iPS (dark grey) or partially reprogrammed cells (piPS, light grey) and fibroblasts (MEF) for genes bound by the indicated combination of factors in ES cells or for all unbound genes (None). (B) The graph divides OSK targets of ES cells according to their expression ratio between indicated cell types. (C) Venn diagram depicting genes bound by OSK in iPS and ES cells but not in partially reprogrammed cells (piPS) (left), genes bound in partially reprogrammed cells but not in ES and iPS cells (right), and genes bound by OSK in all three cell types (overlapping area). Circles are scaled and colored according to the expression difference between iPS cells and piPS.
Figure 5
Figure 5. A distinctive histone methylation pattern for OSK target genes that are most dramatically upregulated in ES/iPS cells compared to fibroblasts
(A) Bar chart depicts the fraction of genes with enrichment of histone H3 K27 trimethylation in their promoter region in different cell types, for genes that are bound by the indicated combination of factors in ES cells. (B) Hierarchical clustering of histone H3 K4 and K27 trimethylation patterns in ES cell, iPS cells, partially reprogrammed cells (piPS) and fibroblasts for genes bound by OSK in ES cells. Each row represents the methylation pattern along the −5.5kb to +2.5kb promoter region relative to the transcription start site (TSS), reiterated eight times to present the data for each cell type and methylation mark. Each 8 kb promoter region is divided into sixteen 500bp fragments that display the average log ratio of probe signal intensity with green, red, and grey representing lower-than-average, higher-than-average, and missing values for enrichment due to lack of probes in those regions, respectively. Binding of the factors in ES (dark grey), iPS (light grey), and partially reprogrammed cells (lightest grey) is presented to the right of the histone methylation data. Two sets of log2 expression ratios are appended (ES/MEF and piPS/ES) and genes most highly expressed in ES cells relative to MEF are marked and listed.
Figure 6
Figure 6. The role of c-Myc in early steps of the reprogramming process
(A) FACS plots showing Thy1 surface levels of fibroblasts two or four days post infection with a retrovirus carrying the indicated factor (blue) in comparison to uninfected fibroblasts (red). (B) Heatmap of expression differences between ES cells and fibroblasts (MEFs) and between fibroblast lines induced for c-Myc, Klf4, Oct4 or Sox2 expression for three days with doxycycline relative to an uninduced fibroblast control, for all genes more than 2-fold differentially expressed between ES cells and MEFs, ordered by decreasing expression ratio. (C) Overlap of genes 2-fold up or down between ES/MEF and 2-fold up or down between MEFs induced to express Oct4, Sox2, Klf4 or c-Myc and uninduced MEFs. The first number presents the genes in the overlap, the second number the enrichment (described in Materials and Methods), and the third number log10 of the p-value. Significant enrichments are highlighted in green. (D) R26-rtTA/wt fibroblasts were infected with three constitutively expressed retroviruses (const) and a dox-inducible retrovirus for the fourth factor (tet). Doxycycline (dox) was added until the indicated day and AP-positive colonies scored on day 25.
Figure 7
Figure 7. Role of the four factors during reprogramming
(A) c-Myc is a major contributor to the down-regulation of fibroblast-specific genes at the beginning of the reprogramming process (i). In iPS cells, c-Myc binds and activates many ES-cell specific genes with roles in metabolic regulation, often with the other three factors (iii). For many of these target genes, binding and activation is also found in partially reprogrammed cells (ii). Target genes that are co-bound by Oct4, Sox2 and Klf4 in ES/iPS cells encode some of the most highly expressed regulators of pluripotency (v) and are not bound and activated at the partially reprogrammed state (iv). Our data suggest that the targeting of OSK to these genes represents a barrier to the reprogramming process and that c-Myc-bound genes largely become activated during earlier steps. (B) State of histone H3K4 and K27 trimethylation within promoter regions of genes that become most highly activated during reprogramming and that are co-bound by Oct4, Sox2 and Klf4 in ES/iPS cells but not partially reprogrammed cells.

References

    1. Bernstein BE, Mikkelsen TS, Xie X, Kamal M, Huebert DJ, Cuff J, Fry B, Meissner A, Wernig M, Plath K, et al. A bivalent chromatin structure marks key developmental genes in embryonic stem cells. Cell. 2006;125:315–326. - PubMed
    1. Boyer LA, Lee TI, Cole MF, Johnstone SE, Levine SS, Zucker JP, Guenther MG, Kumar RM, Murray HL, Jenner RG, et al. Core transcriptional regulatory circuitry in human embryonic stem cells. Cell. 2005;122:947–956. - PMC - PubMed
    1. Brambrink T, Foreman R, Welstead GG, Lengner CJ, Wernig M, Suh H, Jaenisch R. Sequential expression of pluripotency markers during direct reprogramming of mouse somatic cells. Cell Stem Cell. 2008;2:151–159. - PMC - PubMed
    1. Chen X, Xu H, Yuan P, Fang F, Huss M, Vega VB, Wong E, Orlov YL, Zhang W, Jiang J, et al. Integration of external signaling pathways with the core transcriptional network in embryonic stem cells. Cell. 2008;133:1106–1117. - PubMed
    1. Dimos JT, Rodolfa KT, Niakan KK, Weisenthal LM, Mitsumoto H, Chung W, Croft GF, Saphier G, Leibel R, Goland R, et al. Induced pluripotent stem cells generated from patients with ALS can be differentiated into motor neurons. Science. 2008;321:1218–1221. - PubMed

Publication types

Associated data