. 2009 Apr;58(4):867-74.
doi: 10.2337/db08-0606. Epub 2009 Jan 23.

BMI changes during childhood and adolescence as predictors of amount of adult subcutaneous and visceral adipose tissue in men: the GOOD Study

Affiliations

BMI changes during childhood and adolescence as predictors of amount of adult subcutaneous and visceral adipose tissue in men: the GOOD Study

Jenny M Kindblom et al. Diabetes. 2009 Apr.

Abstract

Objective: The amount of visceral adipose tissue is a risk factor for the metabolic syndrome. It is unclear how BMI changes during childhood and adolescence predict adult fat distribution. We hypothesized that there are critical periods during development for the prediction of adult subcutaneous and visceral fat mass by BMI changes during childhood and adolescence.

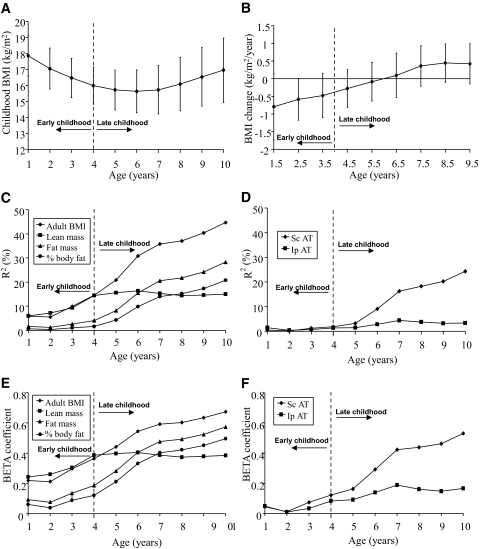
Research design and methods: Detailed growth charts were retrieved for the men participating in the population-based Gothenburg Osteoporosis and Obesity Determinants (GOOD) Study (n = 612). Body composition was analyzed using dual-energy X-ray absorptiometry and adipose tissue areas using abdominal computed tomography at 18 to 20 years of age.

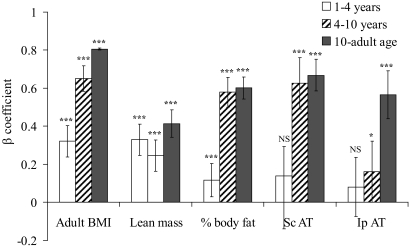
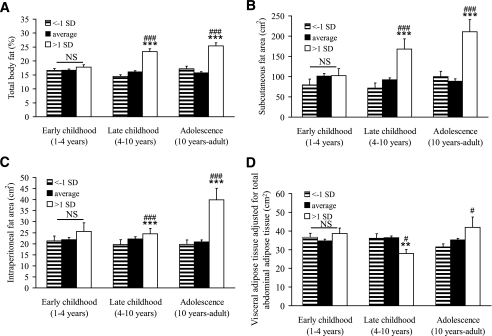
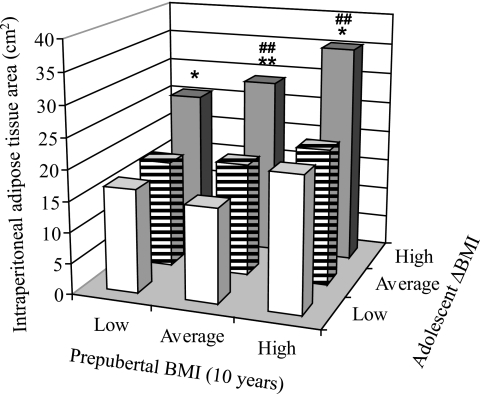
Results: The main finding in the present study was that subjects with increases in BMI Z score of more than 1 SD during adolescence had, independent of prepubertal BMI, both larger subcutaneous (+138%; P < 0.001) and visceral adipose tissue areas (+91%; P < 0.001) than subjects with unchanged BMI Z-score. In contrast, subjects with increases in BMI Z score of more than 1 SD during late childhood had a larger amount of adult subcutaneous adipose tissue (+83%; P < 0.001) than subjects with unchanged BMI Z score but an unaffected amount of visceral adipose tissue. BMI changes during adolescence predict both visceral and subcutaneous adipose tissue of the abdomen, whereas BMI changes during late childhood predict only the subcutaneous adipose tissue.

Conclusions: The amount of visceral adipose tissue in young adult men was associated with BMI changes specifically during adolescence, whereas the amount of subcutaneous adipose tissue was associated with BMI changes during both late childhood and adolescence.


Figures

FIG. 1.
FIG. 1.
Childhood BMI and variance in body composition and fat variables (BMI [A] and BMI change [B]) during early and late childhood. Data are means ± SD (C–F). Association between childhood BMI between 1 and 10 years of age and young-adult body composition parameters is expressed as accumulated R2 (%, C and D) or β coefficients (SD in adult body composition parameter per SD in BMI at that age, E and F). Variables of adult body composition and fat distribution have been age adjusted. AT, adipose tissue; Ip, intraperitoneal; Sc, subcutaneous.
FIG. 2.
FIG. 2.
Correlation between change in standardized BMI during different developmental time periods and adult body composition and fat distribution parameters (early childhood defined as 1–4 years, late childhood defined as 4–10 years, and adolescence defined as 10 years to young adult). Bars indicate β coefficient (95% CIs) expressed as SD in investigated adult body composition parameter per SD change in BMI during that growth period. Variables of adult body composition and fat distribution have been age adjusted. ***P < 0.01, *P < 0.05 significant association between the developmental time period and the investigated body composition parameter. 95% CIs are given for the β coefficients, making it possible to evaluate the differences in relative contribution of the three time periods for each dependent parameter. AT, adipose tissue; Ip, intraperitoneal; NS, not significant; Sc, subcutaneous.
FIG. 3.
FIG. 3.
The impact of developmental BMI changes for percentage total body fat (A), subcutaneous adipose tissue area (B), intraperitoneal adipose tissue area (C), and visceral (intraperitoneal + retroperitoneal) adipose tissue adjusted for total abdominal (visceral + subcutaneous) adipose tissue area (D). Subjects with more than 1 SD increase were compared with subjects with average change or less than −1 SD decrease in standardized BMI during early childhood (1–4 years of age), late childhood (4–10 years of age), and adolescence (10–19 years of age). Variables of adult body composition and fat distribution have been age adjusted and are expressed as means ± SEM and were analyzed using ANOVA followed by Tukey's post hoc analysis. ***P < 0.001 versus average, **P < 0.01 versus average, ###P < 0.001 versus less than −1 SD decrease, and #P < 0.05 versus less than −1 SD. NS, not significant. A: Early childhood less than −1 SD, n = 72, average n = 471; more than 1 SD, n = 67; late childhood less than −1 SD, n = 75, average n = 462; more than 1 SD, n = 73; adolescence less than −1 SD, n = 55, average n = 500; more than 1 SD, n = 55. B–D: Early childhood less than −1 SD, n = 21, average n = 160; more than 1 SD, n = 20; late childhood less than −1 SD, n = 22, average n = 154; more than 1 SD, n = 25; adolescence less than −1 SD, n = 22, average n = 164; more than 1 SD, n = 15.
FIG. 4.
FIG. 4.
BMI increases during adolescence are associated with high adult visceral fat mass in subjects with low, average, and high prepubertal BMI. Intraperitoneal fat area (y-axis) in subjects divided into tertiles according to (i) prepubertal BMI (x-axis; low, average, and high) and (ii) BMI-Z score increase during adolescence (z-axis; low, average, and high). The intraperitoneal adipose tissue area has been age adjusted. Data are expressed as means and were analyzed using ANOVA followed by Tukey's post hoc analysis. *P < 0.05, **P < 0.01 versus average BMI Z score change during adolescence (▤); ##P < 0.01 versus low (□). N for lowest ΔBMI during adolescence (□) from low prepubertal BMI to high (left to right) 9, 19, and 39; for average ΔBMI during adolescence (▤) low prepubertal BMI to high (left to right) 26, 25, and 16; and for high ΔBMI during adolescence (▩) from low prepubertal BMI to high (left to right) 32, 23, and 12. N for all = 201.

References

    1. Weiss R, Dziura J, Burgert TS, Tamborlane WV, Taksali SE, Yeckel CW, Allen K, Lopes M, Savoye M, Morrison J, Sherwin RS, Caprio S: Obesity and the metabolic syndrome in children and adolescents. N Engl J Med 350: 2362– 2374, 2004 - PubMed
    1. Hedley AA, Ogden CL, Johnson CL, Carroll MD, Curtin LR, Flegal KM: Prevalence of overweight and obesity among US children, adolescents, and adults, 1999–2002. JAMA 291: 2847– 2850, 2004 - PubMed
    1. Arsenault BJ, Lachance D, Lemieux I, Almeras N, Tremblay A, Bouchard C, Perusse L, Despres JP: Visceral adipose tissue accumulation, cardiorespiratory fitness, and features of the metabolic syndrome. Arch Intern Med 167: 1518– 1525, 2007 - PubMed
    1. Goodpaster BH, Krishnaswami S, Harris TB, Katsiaras A, Kritchevsky SB, Simonsick EM, Nevitt M, Holvoet P, Newman AB: Obesity, regional body fat distribution, and the metabolic syndrome in older men and women. Arch Intern Med 165: 777– 783, 2005 - PubMed
    1. Fox CS, Massaro JM, Hoffmann U, Pou KM, Maurovich-Horvat P, Liu CY, Vasan RS, Murabito JM, Meigs JB, Cupples LA, D'Agostino RB, Sr, O'Donnell CJ: Abdominal visceral and subcutaneous adipose tissue compartments. Association with metabolic risk factors in the Framingham Heart Study. Circulation 116: 39– 48, 2007 - PubMed

Publication types