. 2009 Oct;19(10):2439-50.
doi: 10.1093/cercor/bhn260. Epub 2009 Jan 23.

Intermediate neuronal progenitors (basal progenitors) produce pyramidal-projection neurons for all layers of cerebral cortex

Affiliations

Intermediate neuronal progenitors (basal progenitors) produce pyramidal-projection neurons for all layers of cerebral cortex

Tom Kowalczyk et al. Cereb Cortex. 2009 Oct.

Abstract

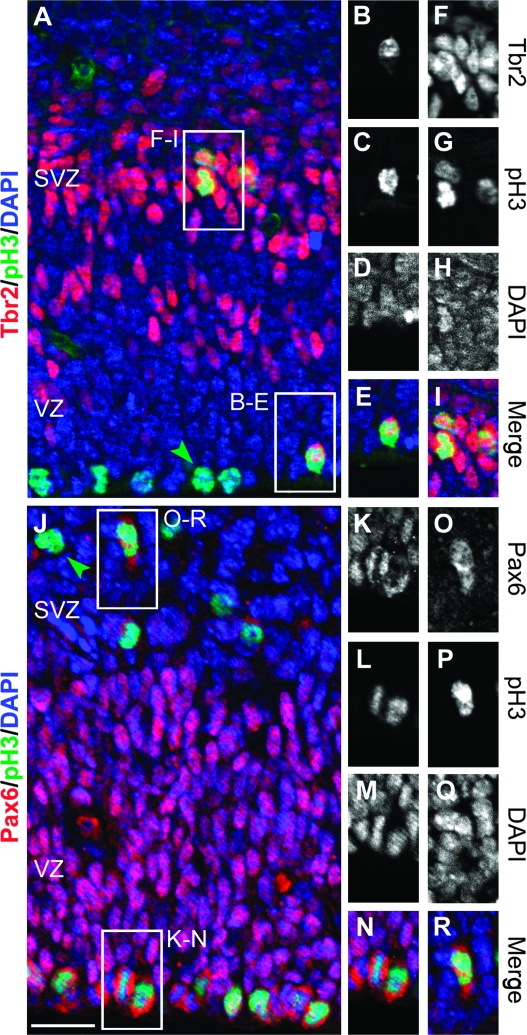
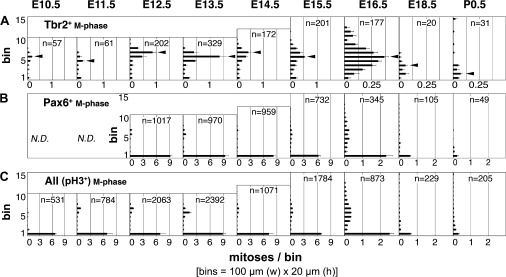
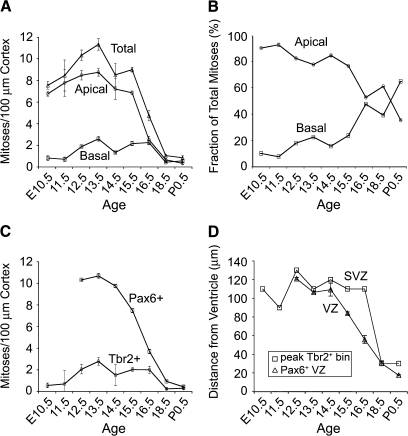
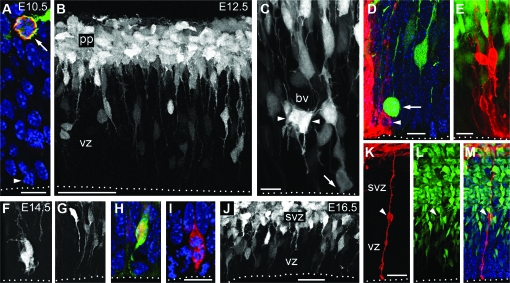
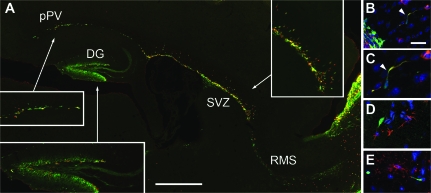
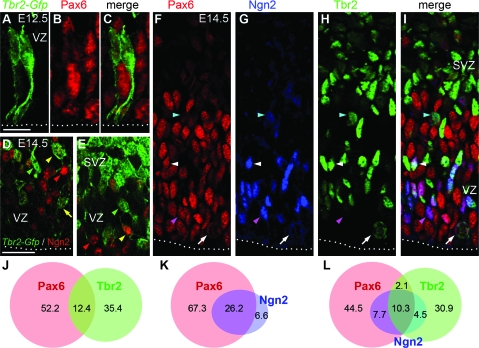
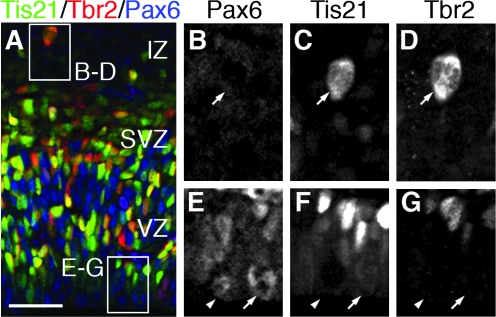
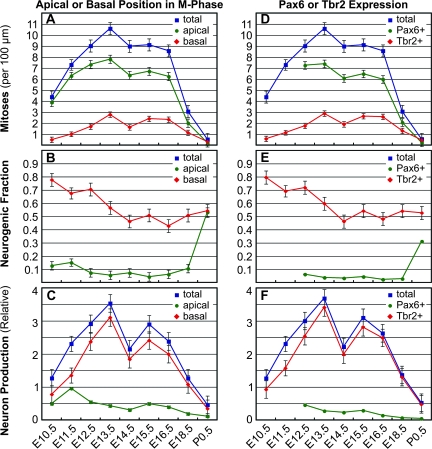
The developing cerebral cortex contains apical and basal types of neurogenic progenitor cells. Here, we investigated the cellular properties and neurogenic output of basal progenitors, also called intermediate neuronal progenitors (INPs). We found that basal mitoses expressing transcription factor Tbr2 (an INP marker) were present throughout corticogenesis, from embryonic day 10.5 through birth. Postnatally, Tbr2(+) progenitors were present in the dentate gyrus, subventricular zone (SVZ), and posterior periventricle (pPV). Two morphological subtypes of INPs were distinguished in the embryonic cortex, "short radial" in the ventricular zone (VZ) and multipolar in the SVZ, probably corresponding to molecularly defined INP subtypes. Unexpectedly, many short radial INPs appeared to contact the apical (ventricular) surface and some divided there. Time-lapse video microscopy suggested that apical INP divisions produced daughter INPs. Analysis of neurogenic divisions (Tis21-green fluorescent protein [GFP](+)) indicated that INPs may produce the majority of projection neurons for preplate, deep, and superficial layers. Conversely, proliferative INP divisions (Tis21-GFP(-)) increased from early to middle corticogenesis, concomitant with SVZ growth. Our findings support the hypothesis that regulated amplification of INPs may be an important factor controlling the balance of neurogenesis among different cortical layers.


Figures

Figure 1.
Figure 1.
M-phase location and transcription factor expression distinguish progenitor types in E14.5 mouse cortex. (AI) Tbr2+ (red) INPs divided in both the SVZ and the VZ, including rare divisions at the ventricular (apical) surface. Some divisions showed uneven distribution of Tbr2 protein, possibly suggestive of asymmetric division (BE). Most apical mitoses (green arrowhead, A) showed no Tbr2 protein. (JR) Highly Pax6+ (red) RGPs divided at the apical surface (KN). Pax6 was present at low levels in some SVZ divisions (green arrowhead, J) and rarely reached levels comparable to apical divisions (OR). Scale bar: 20 μm.
Figure 2.
Figure 2.
M-phase divisions (pH3+) binned by distance from the ventricular surface (20-μm bins) in parietal cortex from E10.5 through P0.5. (A) Tbr2+ mitoses (INPs) were most abundant along the basal edge of the VZ (arrowheads), equivalent to the SVZ visible histologically on E13.5 and later. At the end of neurogenesis (E16.5–P0.5), the SVZ broadened and shifted closer to the ventricular surface, as the VZ involuted. (B) Highly Pax6+ mitoses were most numerous at the apical surface (bin 1) representing RGPs; few basal divisions (INPs) contained high Pax6. (C) Mitoses were most abundant at apical/subapical positions (bin 1) throughout neurogenesis.
Figure 3.
Figure 3.
Dynamics of INP and RGP abundance. (A) Apical/subapical mitoses (bin 1 of Fig. 2) were more numerous than basal mitoses until late in neurogenesis. Basal progenitors fluctuated, with a significant dip on E14.5. (B) As neurogenesis progressed, the relative proportion of apical progenitors declined and basal progenitors rose. (C) Divisions identified by Pax6 and Tbr2 expression generally paralleled apical and basal mitoses, respectively. (D) Tbr2+ mitoses were most abundant (squares, representing peak bins identified by arrowheads in Fig. 2A) at the basal edge of the VZ (triangles), identified as the basal edge of the zone of high Pax6 expression. Note SVZ broadening and VZ involution beginning on E15.5.
Figure 4.
Figure 4.
INP divisions and morphological subtypes. (A) In E10.5 cortex, Tbr2 (red) and Tbr2-GFP (green) were expressed by virtually all basal progenitors (arrow). A small proportion of apical progenitors expressed Tbr2, but most did not (arrowhead). Basal and apical divisions of Tbr2-GFP+ cells are also documented in Supplementary Movies 1 and 2. (BC) On E12.5, Tbr2-GFP (white) was detected in a subset of VZ cells and in most preplate (pp) neurons. In the VZ, Tbr2-GFP+ cells exhibited mainly short radial, but also some multipolar morphologies (arrowheads, C). The latter were often clustered around blood vessels (bv). Some Tbr2-GFP+ cells appeared to divide at the apical surface (arrow, C). (DE) DiI (red) labeling (E12.5) from the pial surface–labeled RGPs (including a mitotic RGP, arrowhead) but not Tbr2-GFP+ (green) basal progenitors in the VZ (arrow indicates a mitotic INP). (FI) In E14.5 VZ, Tbr2-GFP (green or white), and Tbr2 (red) expression revealed multipolar (F) and short radial (GI) INP morphologies. The latter sometimes contacted the ventricular surface (HI). A Tbr2+ mitotic figure is shown in (I). (JM) E16.5 cortex, showing radial and multipolar morphologies of Tbr2-GFP+ cells (white in J, green in KM), and absence of Tbr2-GFP expression in DiI-labeled (red) RGPs (arrowhead, KM). Dotted lines indicate the ventricular surface. Scale bars: (A) 10 μm; (B) 50 μm; (C) 10 μm; (D) 10 μm; (E) 15 μm; (FG) 20 μm (in I); (H) 15 μm (in I); (I) 10 μm; (J) 20 μm; (KM) 25 μm.
Figure 5.
Figure 5.
Tbr2 and Tbr2-GFP expression in P7 cortex. (A) Double labeling for Tbr2 (red) and Tbr2-GFP (green) showed double-labeled cells in the DG, the pPV adjacent to hippocampus (Nakatomi et al. 2002), the SVZ, and the RMS. Insets show selected zones at higher magnification. Parasagittal. (BC) Double labeling for doublecortin (red) and Tbr2-GFP (green) in neocortex adjacent to SVZ confirmed neuronal differentiation. Panel (C) shows higher magnification of a cell with migratory morphology from (B). (D) Double labeling for GFAP (red) and Tbr2-GFP (green) in the cerebral cortex showed no astrocytic differentiation. (E) Double labeling for O4 (red) and Tbr2-GFP (green) showed no oligodendroglial differentiation. Scale bars: (A) 500 μm (250 μm for insets); (B, DE) 20 μm (in B); (C) 10 μm (in B).
Figure 6.
Figure 6.
Ngn2 is expressed by subsets of RGPs and INPs. (AC) Double labeling of Tbr2-GFP (green) and Pax6 (red) in E12.5 cortex (merged image in C). SNP-like INPs expressed low to absent levels of Pax6. (DE) Double labeling of Tbr2-GFP (green) and Ngn2 (red) in E14.5 cortex. Ngn2 was expressed by some Tbr2-GFP+ INPs, including multipolar (yellow arrowheads) and SNP-like (yellow arrow) types. Some Tbr2-GFP+ INPs lacked Ngn2 (green arrowheads). Conversely, some Ngn2+ cells (likely RGPs) did not express Tbr2-GFP (red arrowhead). (FI) Triple labeling to detect Pax6 (red), Ngn2 (blue), and Tbr2 (green) in E14.5 cortex (merged image in I). Various combinations of transcription factor coexpression were observed. Some Tbr2+ INPs had no detectable Pax6 or Ngn2, especially in the SVZ; some expressed Ngn2 but little or no Pax6 (blue arrowhead); others expressed all 3 transcription factors, including interphase (white arrowhead) and, rarely, M-phase basally dividing cells (white arrow). Cells expressing Pax6 and Ngn2, but not Tbr2, were presumed RGPs (purple arrowhead). (JL) Overlapping expression of Pax6, Ngn2, and Tbr2 in VZ and SVZ cells, illustrated by Venn diagrams (n = 863 cells counted by triple-label immunofluorescence). Numbers indicate the percentage of cells in each area of the graph. Scale bars: (AC) 10 μm; (DE) 30 μm; (FI) 20 μm (in D).
Figure 7.
Figure 7.
Tis21-GFP expression distinguishes proliferative (Tis21-GFP) and neurogenic (Tis21-GFP+) INP and apical progenitor divisions. (AG) Triple labeling for Tbr2 (red), Tis21-GFP (green), and Pax6 (blue) in E14.5 cortex. (A) Merged image. (BD) Higher magnification of basal mitosis with neurogenic INP expression profile (Tis21-GFP+/Pax6/Tbr2+), located in the intermediate zone (IZ). (EG) Higher magnification of 2 apical progenitor mitoses: one proliferative (Tis21-GFP/Pax6+/Tbr2) and one neurogenic (Tis21-GFP+/Pax6+/Tbr2). Scale bar: (A) 50 μm; (BG) 20 μm.
Figure 8.
Figure 8.
Neurogenic output of INP and apical progenitor divisions as indicated by Tis21-GFP expression. (AC) Comparison of apical and basal mitoses. Apical divisions were more numerous than basal throughout neurogenesis (A), but basal divisions were more often neurogenic (B). (DF) Comparison of Tbr2+ and highly Pax6+ mitoses. Pax6+ divisions were more numerous (D), but Tbr2+ divisions were more often neurogenic (E). Neurogenic output from INPs was found to be higher than from RGPs, regardless of whether progenitor types were defined by apical or basal division (C) or by transcription factor expression (F).

References

    1. Anthony TE, Klein C, Fishell G, Heintz N. Radial glia serve as neuronal progenitors in all regions of the central nervous system. Neuron. 2004;41:881–890. - PubMed
    1. Arnold SJ, Huang GJ, Cheung AF, Era T, Nishikawa S, Bikoff EK, Molnár Z, Robertson EJ, Groszer M. The T-box transcription factor Eomes/Tbr2 regulates neurogenesis in the cortical subventricular zone. Genes Dev. 2008;22:2479–2484. - PMC - PubMed
    1. Attardo A, Calegari F, Haubensak W, Wilsch-Bräuninger M, Huttner WB. Live imaging at the onset of cortical neurogenesis reveals differential appearance of the neuronal phenotype in apical versus basal progenitor progeny. PLoS ONE. 2008;3:e2388. - PMC - PubMed
    1. Bayatti N, Moss JA, Sun L, Ambrose P, Ward JF, Lindsay S, Clowry GJ. A molecular neuroanatomical study of the developing human neocortex from 8 to 17 postconceptional weeks revealing the early differentiation of the subplate and subventricular zone. Cereb Cortex. 2008;18:1536–1548. - PMC - PubMed
    1. Boulder Committee. Embryonic vertebrate central nervous system: revised terminology. Anat Rec. 1970;166:257–262. - PubMed

Publication types