Photoactivatable mCherry for high-resolution two-color fluorescence microscopy
- PMID: 19169259
- PMCID: PMC2901231
- DOI: 10.1038/nmeth.1298
Photoactivatable mCherry for high-resolution two-color fluorescence microscopy
Erratum in
- Nat Methods. 2009 Apr;6(4):311
Abstract
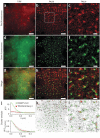
The reliance of modern microscopy techniques on photoactivatable fluorescent proteins prompted development of mCherry variants that are initially dark but become red fluorescent after violet-light irradiation. Using ensemble and single-molecule characteristics as selection criteria, we developed PAmCherry1 with excitation/emission maxima at 564/595 nm. Compared to other monomeric red photoactivatable proteins, it has faster maturation, better pH stability, faster photoactivation, higher photoactivation contrast and better photostability. Lack of green fluorescence and single-molecule behavior make monomeric PAmCherry1 a preferred tag for two-color diffraction-limited photoactivation imaging and for super-resolution techniques such as one- and two-color photoactivated localization microscopy (PALM). We performed PALM imaging using PAmCherry1-tagged transferrin receptor expressed alone or with photoactivatable GFP-tagged clathrin light chain. Pair correlation and cluster analyses of the resulting PALM images identified < or =200 nm clusters of transferrin receptor and clathrin light chain at < or =25 nm resolution and confirmed the utility of PAmCherry1 as an intracellular probe.
Figures


Comment in
-
Red lights, camera, photoactivation!Nat Methods. 2009 Feb;6(2):124-5. doi: 10.1038/nmeth0209-124. Nat Methods. 2009. PMID: 19180093 No abstract available.
Similar articles
-
Bright monomeric photoactivatable red fluorescent protein for two-color super-resolution sptPALM of live cells.J Am Chem Soc. 2010 May 12;132(18):6481-91. doi: 10.1021/ja100906g. J Am Chem Soc. 2010. PMID: 20394363 Free PMC article.
-
Photoactivation mechanism of PAmCherry based on crystal structures of the protein in the dark and fluorescent states.Proc Natl Acad Sci U S A. 2009 Dec 15;106(50):21097-102. doi: 10.1073/pnas.0909204106. Epub 2009 Nov 23. Proc Natl Acad Sci U S A. 2009. PMID: 19934036 Free PMC article.
-
Efficient switching of mCherry fluorescence using chemical caging.Proc Natl Acad Sci U S A. 2017 Jul 3;114(27):7013-7018. doi: 10.1073/pnas.1617280114. Epub 2017 Jun 19. Proc Natl Acad Sci U S A. 2017. PMID: 28630286 Free PMC article.
-
A detailed review of genetically encodable RFPs and far-RFPs and their applications in advanced super-resolution imaging techniques.Biophys Chem. 2025 Jul;322:107432. doi: 10.1016/j.bpc.2025.107432. Epub 2025 Mar 15. Biophys Chem. 2025. PMID: 40117991 Review.
-
Super-resolution localization microscopy with photoactivatable fluorescent marker proteins.Protoplasma. 2014 Mar;251(2):349-62. doi: 10.1007/s00709-013-0566-z. Epub 2013 Oct 27. Protoplasma. 2014. PMID: 24162869 Review.
Cited by
-
Multiscale spatial organization of RNA polymerase in Escherichia coli.Biophys J. 2013 Jul 2;105(1):172-81. doi: 10.1016/j.bpj.2013.05.048. Biophys J. 2013. PMID: 23823236 Free PMC article.
-
Local palmitoylation cycles define activity-regulated postsynaptic subdomains.J Cell Biol. 2013 Jul 8;202(1):145-61. doi: 10.1083/jcb.201302071. J Cell Biol. 2013. PMID: 23836932 Free PMC article.
-
2D map projections for visualization and quantitative analysis of 3D fluorescence micrographs.Sci Rep. 2015 Jul 24;5:12457. doi: 10.1038/srep12457. Sci Rep. 2015. PMID: 26208256 Free PMC article.
-
Transcriptional suppression of ribosomal DNA with phase separation.Sci Adv. 2020 Oct 14;6(42):eabb5953. doi: 10.1126/sciadv.abb5953. Print 2020 Oct. Sci Adv. 2020. PMID: 33055158 Free PMC article.
-
Determination of two-photon photoactivation rates of fluorescent proteins.Phys Chem Chem Phys. 2013 Sep 28;15(36):14868-72. doi: 10.1039/c3cp51035b. Phys Chem Chem Phys. 2013. PMID: 23852136 Free PMC article.
References
-
- Lukyanov KA, Chudakov DM, Lukyanov S, Verkhusha VV. Innovation: Photoactivatable fluorescent proteins. Nat. Rev. Mol. Cell Biol. 2005;6:885–891. - PubMed
-
- Hell SW. Far-field optical nanoscopy. Science. 2007;316:1153–1158. - PubMed
-
- Betzig E, et al. Imaging intracellular fluorescent proteins at nanometer resolution. Science. 2006;313:1642–1645. - PubMed
Publication types
MeSH terms
Substances
Grants and funding
LinkOut - more resources
Full Text Sources
Other Literature Sources
Research Materials

