. 2008;36(6):2605-2637.
doi: 10.1214/07-AOS504.

High Dimensional Classification Using Features Annealed Independence Rules

Affiliations

High Dimensional Classification Using Features Annealed Independence Rules

Jianqing Fan et al. Ann Stat. 2008.

Abstract

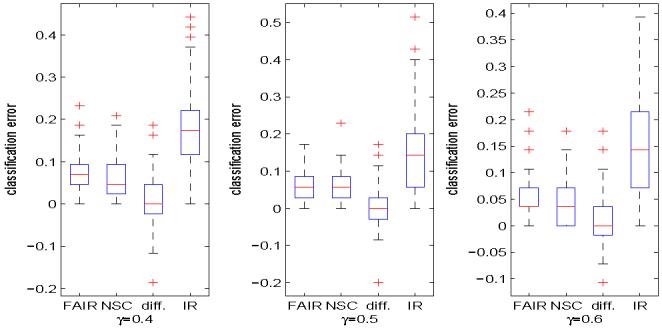
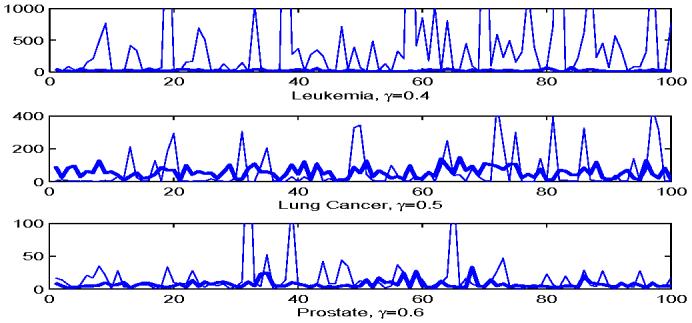
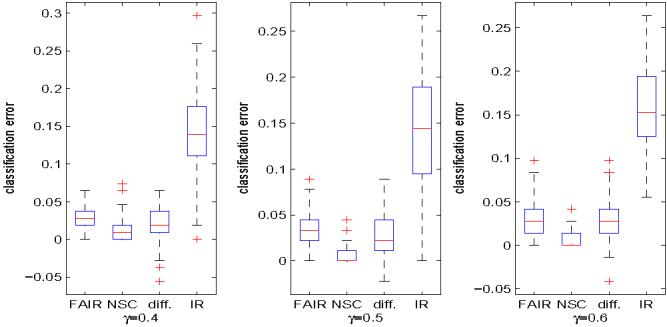
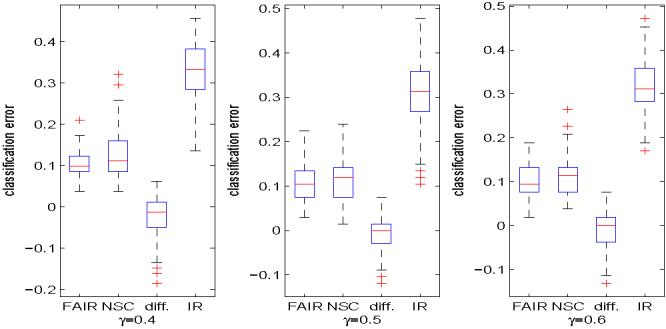
Classification using high-dimensional features arises frequently in many contemporary statistical studies such as tumor classification using microarray or other high-throughput data. The impact of dimensionality on classifications is largely poorly understood. In a seminal paper, Bickel and Levina (2004) show that the Fisher discriminant performs poorly due to diverging spectra and they propose to use the independence rule to overcome the problem. We first demonstrate that even for the independence classification rule, classification using all the features can be as bad as the random guessing due to noise accumulation in estimating population centroids in high-dimensional feature space. In fact, we demonstrate further that almost all linear discriminants can perform as bad as the random guessing. Thus, it is paramountly important to select a subset of important features for high-dimensional classification, resulting in Features Annealed Independence Rules (FAIR). The conditions under which all the important features can be selected by the two-sample t-statistic are established. The choice of the optimal number of features, or equivalently, the threshold value of the test statistics are proposed based on an upper bound of the classification error. Simulation studies and real data analysis support our theoretical results and demonstrate convincingly the advantage of our new classification procedure.


Figures

Figure 1
Figure 1
True mean difference vector α. x-axis represents the dimensionality, and y-axis shows the values of corresponding entries of α.
Figure 2
Figure 2
Number of features versus misclassification rates. The solid curves represent the averages of classification errors across 100 simulations. The dashed curves are 2 standard errors away from the solid curves. The x-axis represents the number of features used in the classification, and the y-axis shows the misclassification rates. (a) The features are ordered in a way such that the corresponding t-statistics are decreasing in absolute values. (b) The amplified plot of the first 80 values of x-axis in plot (a). (c) The same as (a) except that the features are arranged in a way such that the corresponding true mean differences are decreasing in absolute values. (d) The amplified plot of the first 80 values of x-axis in plot (c).
Figure 3
Figure 3
Classification errors of the independence rule based on projected samples onto randomly chosen directions over 100 simulations.
Figure 4
Figure 4
The thick curves correspond to FAIR, while the thin curves correspond to the nearest shrunken centroids method. (a) The numbers of features chosen by (4.3) and by the nearest shrunken centroids method over 100 simulations. (b) Corresponding classification errors based on the optimal number of features chosen in (a) over 100 simulations.
Figure 5
Figure 5
Leukemia data. Boxplots of test errors of FAIR, NSC and the independence rule without feature selection over 100 random splits of 72 samples, where 100γ% of the samples from both classes are set as training samples. The three plots from left to right correspond to γ = 0.4, 0.5 and 0.6, respectively. In each boxplot above, “FAIR” refers to the test errors of the feature annealed independent rule; “NSC” corresponds to the test errors of nearest shrunken centroids method; “diff.” means the difference of the test errors of FAIR and those of NSC; and “IR” corresponds the test errors of independence rule without feature selection.
Figure 6
Figure 6
Leukemia, Lung Cancer, and Prostate data sets. The number of features selected by FAIR and NSC over 100 random splits of the total samples. In each split, 100γ% of the samples from both class are set as training samples, and the rest are used as test samples. The three plots from top to bottom correspond to the Leukemia data with γ = 0.4, the Lung Cancer data with γ = 0.5 and the Prostate cancer data with γ = 0.6, respectively. The thin curves show the results from NSC, and the thick curves correspond to FAIR. The plots are truncated to make them easy to view.
Figure 7
Figure 7
Lung cancer data. The same as Figure 5 except that the data set is different.
Figure 8
Figure 8
Prostate cancer data. The same as Figure 5 except that the data set is different.

References

    1. ANTONIADIS A, LAMBERT-LACROIX S, LEBLANC F. Effective dimension reduction methods for tumor classification using gene expression data. Bioinformatics. 2003;19:563–570. - PubMed
    1. BAI Z, SARANADASA H. Effect of high dimension : by an example of a two sample problem. Statistica Sinica. 1996;6:311–329.
    1. BAIR E, HASTIE T, DEBASHIS P, TIBSHIRANI R. Prediction by supervised principal components. The Annals of Statistics. 2007 to appear.
    1. BICKEL PJ, LEVINA E. Some theory for Fisher's linear discriminant function, “naive Bayes”, and some alternatives when there are many more variables than observations. Bernoulli. 2004;10:989–1010.
    1. BOULESTEIX A. PLS Dimension reduction for classification with microarray data. Statistical Applications in Genetics and Molecular Biology. 2004;3:1–33. - PubMed

LinkOut - more resources