Review
. 2009 May-Jun;85(3):631-45.
doi: 10.1111/j.1751-1097.2008.00514.x. Epub 2009 Jan 23.

Nonlinear absorption microscopy

Affiliations
Review

Nonlinear absorption microscopy

Tong Ye et al. Photochem Photobiol. 2009 May-Jun.

Abstract

For the past two decades, nonlinear microscopy has been developed to overcome the scattering problem in thick tissue imaging. Owing to its increased imaging depth and high spatial resolution, nonlinear microscopy becomes the first choice for imaging living tissues. The use of nonlinear optical effects not only facilitates the signal originating from an extremely small volume defined by light focusing but also provides novel contrast mechanisms with molecular specificity. Nonlinear absorption is a nonlinear optical effect in which the absorption coefficient depends on excitation intensity. As a commonly used spectroscopy tool, nonlinear absorption measurement uncovers many photophysical and photochemical processes correlated with electronic states of molecules. Recently we have been focusing on adapting this spectroscopy method to a microscopy imaging technique. The effort leads to a novel modality in nonlinear microscopy-nonlinear absorption microscopy. This article summarizes the principles and instrumentation of this imaging technique and highlights some of the recent progress in applying it to imaging skin pigmentation and microvasculature under ex vivo or in vivo conditions.


Figures

Figure 1.
Figure 1.
Three-level energy diagram used to describe kinetic effects of optical bleaching.
Figure 2.
Figure 2.
A kinetic model for excited state absorption. SE = stimulated emission; Abs = absorption.
Figure 3.
Figure 3.
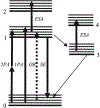
The processes that can yield signals in the pump-probe transient absorption measurement. 2PA = two-photon absorption; 1PA = one-photon absorption; OB = optical bleach; SE = stimulated emission; ESA = excited state absorption.
Figure 4.
Figure 4.
The principle of single beam two-photon absorption measurement. A sinusoidal intensity modulation (10 MHz) of the pulse train from a mode-locked laser (80 MHz) generates sidebands (10 MHz away from 80 MHz and its harmonics) in the frequency domain. Two-photon absorption creates new sidebands in the transmitted light. The new sidebands shift away from the repetition frequency with double the frequency (20 MHz) of the modulation.
Figure 5.
Figure 5.
The principle of the pump-probe transient absorption measurement. The change in transmission (ΔT) of the probe, due to the pump process, reflects the population changes of the ground state and the excited states. The time-evolution of signals can be drawn by varying the interpulse delay between the pump and the probe pulses.
Figure 6.
Figure 6.
Schematic for a typical laser-scanning microscope setup for performing nonlinear absorption microscopy.
Figure 7.
Figure 7.
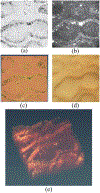
Imaging a fixed human melanoma lesion with a single laser beam. Image size: 266 μm × 266 μm (a) TPA image taken at 20 μm deep in the lesion, (b) TPF image taken at 20 μm deep in the lesion. The nuclei of cells appear in dark round shape due to lack of fluorophores in nuclei, (c) The superposition of the TPA (in gray scale) and TPF (colored) images clearly shows melanin distribution in the skin layers, (d) Bright field image. The dark circular patterns show the epidermis–dermis junction layer containing the malignant melanocytes. (e) 3D volume rendering of TPA signal from human melanoma lesions, which was constructed from 22 imaging sections. The size of the block is 266 μm × 266 μm × 105 μm.
Figure 8.
Figure 8.
Mosaic of five images of an invasive melanoma skin slice in the (a) bright field images of an invasive skin slice taken with a DCM 130 camera; (b) mosaic of 10 laser scanning images of the same skin slice acquired with two-color transient absorption microscopy; (c, d) higher magnification two-color transient absorption images taken with a 40× objective at the two locations indicated with the orange boxes and arrows at the same power levels. Adapted with permission from Fu et al. (31).
Figure 9.
Figure 9.
(a) Bright field imaging and (b) laser scanning two-color TPA image of mouse RBCs. (c) The reconstructed 3D cell image is based on 10 layers with layer separation of 1 fan and image size of 40 μm × 40 μm × 10 μm. Adapted with permission from Fu et al. (66).
Figure 10.
Figure 10.
Bright field image and a series of laser scanning two-color ESA images at various depths in the black mouse ear. The pump is at 650 nm (2.4 mW), and the probe is at 775 nm (1.4 mW). Adapted with permission from Fu el al. (66).
Figure 11.
Figure 11.
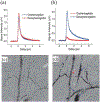
Comparison of the ESA signals of oxyhemoglobin and deoxyhemoglobin with different pump-probe combinations. Arterioles and venules can be discerned in vessel images, (a) ESA signals with 810 nm pump and 735 nm probe; (b) ESA signals with 735 nm pump and 810 probe: (c) blood vessel imaging with 810 nm pump and 735 nm probe: (d) blood vessel imaging with 735 nm pump and 810 nm probe. Adapted with permission from Fu el at. (68).

References

    1. Epstein RJ (2002) Human Molecular Biology: An Introduction to the Molecular Basis of Health and Disease. Cambridge University Press, Cambridge.
    1. Moriyama EH, Zheng G and Wilson BC (2008) Optical molecular imaging: From single cell to patient. Clin. Pharmacol. Ther 84, 267–271. - PubMed
    1. Schwille P, Haupts U, Maiti S and Webb WW (1999) Molecular dynamics in living cells observed by fluorescence correlation spectroscopy with one- and two-photon excitation. Biophys. J 77, 2251–2265. - PMC - PubMed
    1. Yu J, Xiao J, Ren XJ, Lao KQ and Xie XS (2006) Probing gene expression in live cells, one protein molecule at a time. Science 311, 1600–1603. - PubMed
    1. Stosiek C, Garaschuk O, Holthoff K and Konnerth A (2003) In vivo two-photon calcium imaging of neuronal networks. Proc. Natl Acad. Sci. USA 100, 7319–7324. - PMC - PubMed

Publication types