Fingerprinting antioxidative activities in plants
- PMID: 19171044
- PMCID: PMC2656482
- DOI: 10.1186/1746-4811-5-2
Fingerprinting antioxidative activities in plants
Abstract
Background: A plethora of concurrent cellular activities is mobilised in the adaptation of plants to adverse environmental conditions. This response can be quantified by physiological experiments or metabolic profiling. The intention of this work is to reduce the number of metabolic processes studied to a minimum of relevant parameters with a maximum yield of information. Therefore, we inspected 'summary parameters' characteristic for whole classes of antioxidative metabolites and key enzymes.
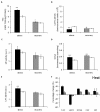
Results: Three bioluminescence assays are presented. A horseradish peroxidase-based total antioxidative capacity (TAC) assay is used to probe low molecular weight antioxidants. Peroxidases are quantified by their luminol converting activity (LUPO). Finally, we quantify high molecular weight superoxide anion scavenging activity (SOSA) using coelenterazine.Experiments with Lepidium sativum L. show how salt, drought, cold, and heat influence the antioxidative system represented here by TAC, LUPO, SOSA, catalase, and glutathione reductase (GR). LUPO and SOSA run anti-parallel under all investigated stress conditions suggesting shifts in antioxidative functions rather than formation of antioxidative power. TAC runs in parallel with GR. This indicates that a majority of low molecular weight antioxidants in plants is represented by glutathione.
Conclusion: The set of assays presented here is capable of characterising antioxidative activities in plants. It is inexpensive, quick and reproducible and delivers quantitative data. 'Summary parameters' like TAC, LUPO, and SOSA are quantitative traits which may be promising for implementation in high-throughput screening for robustness of novel mutants, transgenics, or breeds.
Figures


Similar articles
-
Determination of oxidative stress in wheat leaves as influenced by boron toxicity and NaCl stress.Plant Physiol Biochem. 2012 Jul;56:56-61. doi: 10.1016/j.plaphy.2012.04.011. Epub 2012 Apr 25. Plant Physiol Biochem. 2012. PMID: 22592001
-
Antioxidative responses of duckweed (Lemna minor L.) to short-term copper exposure.Environ Sci Pollut Res Int. 2007 May;14(3):194-201. doi: 10.1065/espr2006.11.364. Environ Sci Pollut Res Int. 2007. PMID: 17561779
-
Salt tolerance and activity of antioxidative enzymes of transgenic finger millet overexpressing a vacuolar H(+)-pyrophosphatase gene (SbVPPase) from Sorghum bicolor.J Plant Physiol. 2014 Jun 15;171(10):789-98. doi: 10.1016/j.jplph.2014.02.001. Epub 2014 Apr 26. J Plant Physiol. 2014. PMID: 24877670
-
Micronutrient fertilization enhances ROS scavenging system for alleviation of abiotic stresses in plants.Plant Physiol Biochem. 2021 Mar;160:386-396. doi: 10.1016/j.plaphy.2021.01.040. Epub 2021 Jan 30. Plant Physiol Biochem. 2021. PMID: 33556754 Review.
-
[Antioxidative enzymes--structure, properties, functions].Pol Merkur Lekarski. 2008 Sep;25(147):266-8. Pol Merkur Lekarski. 2008. PMID: 19112846 Review. Polish.
Cited by
-
Cacao (Theobroma cacao L.) Response to Water Stress: Physiological Characterization and Antioxidant Gene Expression Profiling in Commercial Clones.Front Plant Sci. 2021 Sep 6;12:700855. doi: 10.3389/fpls.2021.700855. eCollection 2021. Front Plant Sci. 2021. PMID: 34552605 Free PMC article.
-
Apoplastic calcium executes a shut-down function on plant peroxidases: a hypothesis.Plant Signal Behav. 2012 Jun;7(6):678-81. doi: 10.4161/psb.20007. Epub 2012 May 14. Plant Signal Behav. 2012. PMID: 22580701 Free PMC article.
-
A coelenterazine-based luminescence assay to quantify high-molecular-weight superoxide anion scavenger activities.Nat Protoc. 2010 Sep;5(10):1635-41. doi: 10.1038/nprot.2010.121. Epub 2010 Sep 16. Nat Protoc. 2010. PMID: 20885375
-
Total low-molecular-weight antioxidants as a summary parameter, quantified in biological samples by a chemiluminescence inhibition assay.Nat Protoc. 2010 Sep;5(10):1627-34. doi: 10.1038/nprot.2010.120. Epub 2010 Sep 16. Nat Protoc. 2010. PMID: 20885374
-
Calcium promotes activity and confers heat stability on plant peroxidases.Plant Signal Behav. 2012 Jun;7(6):650-60. doi: 10.4161/psb.20065. Epub 2012 May 14. Plant Signal Behav. 2012. PMID: 22580695 Free PMC article.
References
-
- Schwarzländer M, Fricker MD, C M, Marty L, Brach T, Novak J, Sweetlove LJ, R H, Meyer AJ. Confocal imaging of glutathione redox potential in living plant cells. J Microsc. 2008;231:299–316. - PubMed
-
- Lee DG, Ahsan N, Lee SH, Kang KY, Bahk JD, Lee IJ, Lee BH. A proteomic approach in analyzing heat-responsive proteins in rice leaves. Proteomics. 2007;7:3369–3383. - PubMed
LinkOut - more resources
Full Text Sources

