

Generation of a predicted protein database from EST data and application to iTRAQ analyses in grape (Vitis vinifera cv. Cabernet Sauvignon) berries at ripening initiation
- PMID: 19171055
- PMCID: PMC2637896
- DOI: 10.1186/1471-2164-10-50
Generation of a predicted protein database from EST data and application to iTRAQ analyses in grape (Vitis vinifera cv. Cabernet Sauvignon) berries at ripening initiation
Abstract
Background: iTRAQ is a proteomics technique that uses isobaric tags for relative and absolute quantitation of tryptic peptides. In proteomics experiments, the detection and high confidence annotation of proteins and the significance of corresponding expression differences can depend on the quality and the species specificity of the tryptic peptide map database used for analysis of the data. For species for which finished genome sequence data are not available, identification of proteins relies on similarity to proteins from other species using comprehensive peptide map databases such as the MSDB.
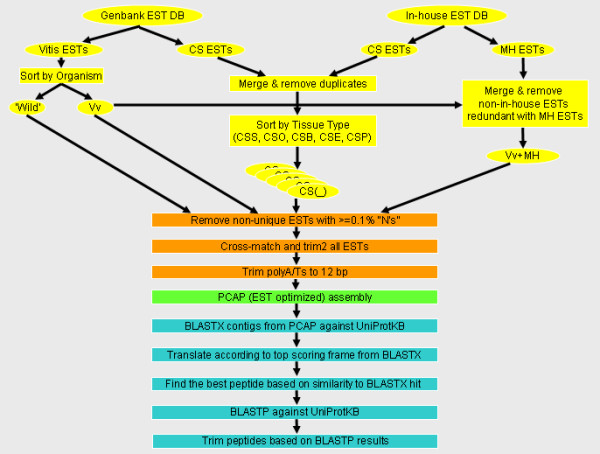
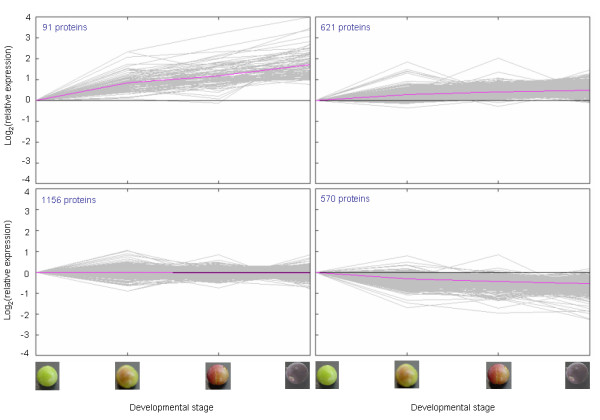
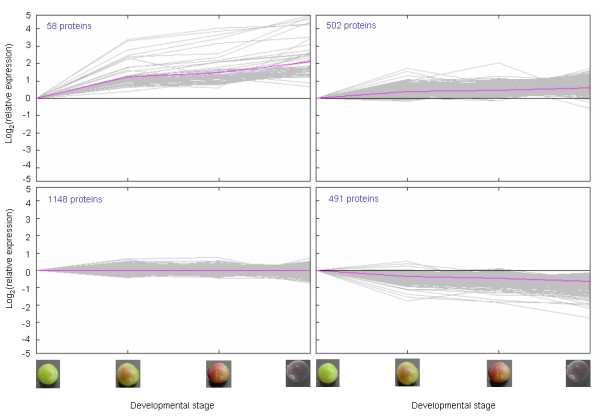
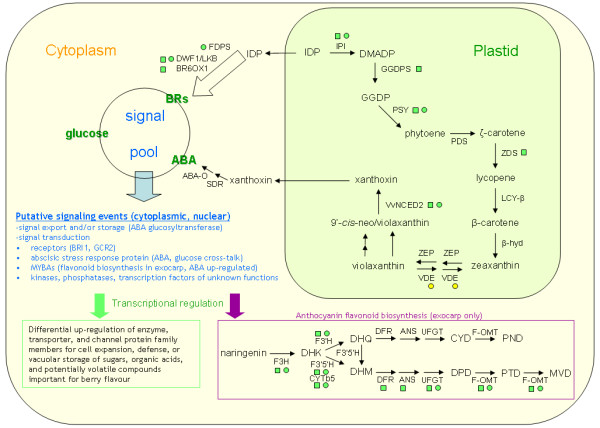
Results: We were interested in characterizing ripening initiation ('veraison') in grape berries at the protein level in order to better define the molecular control of this important process for grape growers and wine makers. We developed a bioinformatic pipeline for processing EST data in order to produce a predicted tryptic peptide database specifically targeted to the wine grape cultivar, Vitis vinifera cv. Cabernet Sauvignon, and lacking truncated N- and C-terminal fragments. By searching iTRAQ MS/MS data generated from berry exocarp and mesocarp samples at ripening initiation, we determined that implementation of the custom database afforded a large improvement in high confidence peptide annotation in comparison to the MSDB. We used iTRAQ MS/MS in conjunction with custom peptide db searches to quantitatively characterize several important pathway components for berry ripening previously described at the transcriptional level and confirmed expression patterns for these at the protein level.
Conclusion: We determined that a predicted peptide database for MS/MS applications can be derived from EST data using advanced clustering and trimming approaches and successfully implemented for quantitative proteome profiling. Quantitative shotgun proteome profiling holds great promise for characterizing biological processes such as fruit ripening initiation and may be further improved by employing preparative techniques and/or analytical equipment that increase peptide detection sensitivity via a shotgun approach.
Figures
Similar articles
-
Generation of ESTs in Vitis vinifera wine grape (Cabernet Sauvignon) and table grape (Muscat Hamburg) and discovery of new candidate genes with potential roles in berry development.Gene. 2007 Nov 1;402(1-2):40-50. doi: 10.1016/j.gene.2007.07.016. Epub 2007 Jul 31. Gene. 2007. PMID: 17761391
-
Transcriptomic and metabolite analyses of Cabernet Sauvignon grape berry development.BMC Genomics. 2007 Nov 22;8:429. doi: 10.1186/1471-2164-8-429. BMC Genomics. 2007. PMID: 18034876 Free PMC article.
-
Berry skin development in Norton grape: distinct patterns of transcriptional regulation and flavonoid biosynthesis.BMC Plant Biol. 2011 Jan 10;11:7. doi: 10.1186/1471-2229-11-7. BMC Plant Biol. 2011. PMID: 21219654 Free PMC article.
-
Integrating genomic, transcriptomic, and interactome data to improve Peptide and protein identification in shotgun proteomics.J Proteome Res. 2014 Jun 6;13(6):2715-23. doi: 10.1021/pr500194t. Epub 2014 May 12. J Proteome Res. 2014. PMID: 24792918 Free PMC article. Review.
-
Distribution and Features of the Six Classes of Peroxiredoxins.Mol Cells. 2016 Jan;39(1):53-9. doi: 10.14348/molcells.2016.2330. Epub 2016 Jan 25. Mol Cells. 2016. PMID: 26810075 Free PMC article. Review.
Cited by
-
Proteomic analysis of grape berry cell cultures reveals that developmentally regulated ripening related processes can be studied using cultured cells.PLoS One. 2011 Feb 17;6(2):e14708. doi: 10.1371/journal.pone.0014708. PLoS One. 2011. PMID: 21379583 Free PMC article.
-
Proteome analysis of pear reveals key genes associated with fruit development and quality.Planta. 2015 Jun;241(6):1363-79. doi: 10.1007/s00425-015-2263-y. Epub 2015 Feb 15. Planta. 2015. PMID: 25682102
-
iTRAQ-based quantitative proteomics of developing and ripening muscadine grape berry.J Proteome Res. 2014 Feb 7;13(2):555-69. doi: 10.1021/pr400731p. Epub 2013 Dec 6. J Proteome Res. 2014. PMID: 24251720 Free PMC article.
-
Systematically quantitative proteomics and metabolite profiles offer insight into fruit ripening behavior in Fragaria × ananassa.RSC Adv. 2019 May 7;9(25):14093-14108. doi: 10.1039/c9ra00549h. eCollection 2019 May 7. RSC Adv. 2019. PMID: 35519301 Free PMC article.
-
Antioxidant Defenses in Plants with Attention to Prunus and Citrus spp.Antioxidants (Basel). 2013 Nov 26;2(4):340-69. doi: 10.3390/antiox2040340. Antioxidants (Basel). 2013. PMID: 26784469 Free PMC article. Review.
References
-
- Shilov IV, Seymour SL, Patel AA, Loboda A, Tang WH, Keating SP, Hunter CL, Nuwaysir LM, Schaeffer DA. The Paragon algorithm: A next generation search engine that uses sequence temperature values and feature probabilities to identify peptides from tandem mass spectra. Mol Cell Prot. 2007;6:1638–1655. doi: 10.1074/mcp.T600050-MCP200. - DOI - PubMed
Publication types
MeSH terms
Substances
LinkOut - more resources
Full Text Sources
Research Materials
Miscellaneous
