. 2009;8(1):9.
doi: 10.1186/jbiol108. Epub 2009 Jan 26.

A circuit supporting concentration-invariant odor perception in Drosophila

Affiliations

A circuit supporting concentration-invariant odor perception in Drosophila

Kenta Asahina et al. J Biol. 2009.

Abstract

Background: Most odors are perceived to have the same quality over a large concentration range, but the neural mechanisms that permit concentration-invariant olfactory perception are unknown. In larvae of the vinegar fly Drosophila melanogaster, odors are sensed by an array of 25 odorant receptors expressed in 21 olfactory sensory neurons (OSNs). We investigated how subsets of larval OSNs with overlapping but distinct response properties cooperate to mediate perception of a given odorant across a range of concentrations.

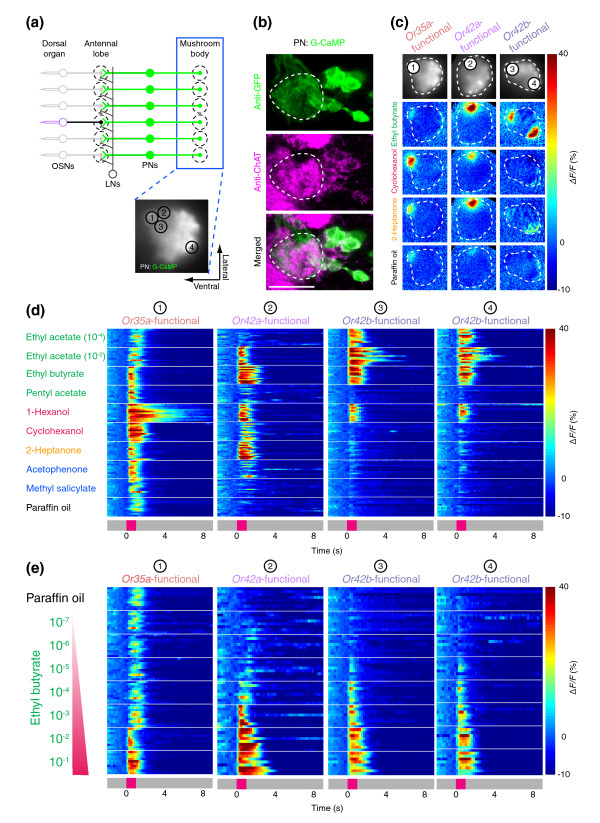
Results: Using calcium imaging, we found that ethyl butyrate, an ester perceived by humans as fruity, activated three OSNs with response thresholds that varied across three orders of magnitude. Whereas wild-type larvae were strongly attracted by this odor across a 500-fold range of concentration, individuals with only a single functional OSN showed attraction across a narrower concentration range corresponding to the sensitivity of each ethyl butyrate-tuned OSN. To clarify how the information carried by different OSNs is integrated by the olfactory system, we characterized the response properties of local inhibitory interneurons and projection neurons in the antennal lobe. Local interneurons only responded to high ethyl butyrate concentrations upon summed activation of at least two OSNs. Projection neurons showed a reduced response to odors when summed input from two OSNs impinged on the circuit compared to when there was only a single functional OSN.

Conclusions: Our results show that increasing odor concentrations induce progressive activation of concentration-tuned olfactory sensory neurons and concomitant recruitment of inhibitory local interneurons. We propose that the interplay of combinatorial OSN input and local interneuron activation allows animals to remain sensitive to odors across a large range of stimulus intensities.


Figures

Figure 1
Figure 1
Imaging odor-evoked activity in larval olfactory neurons. (a) Schematic of the larval imaging preparation showing head dissection (left) and mounting of inverted sample for G-CaMP imaging (right). (b) Whole-mount immunofluorescence staining of G-CaMP in terminals of Or35a and Or42a OSNs (anti-GFP; green) counterstained with the neuropil marker nc82 (magenta). Confocal image is a flattened z-stack of 7 × 7.2 μm optical slices that covers the anterior portion of the larval brain neuropil oriented with anterior at bottom. Scale bar = 50 μm. Genotypes for this and all other strains used in the paper are listed in the Additional data file 1. (c) Schematic of the larval olfactory circuit of the animal in (b). Olfactory sensory neuron (OSN) activity is imaged at axon terminals in the antennal lobe (blue box). Glomeruli also receive input from local interneurons (LNs) and projection neurons (PNs). Intrinsic G-CaMP fluorescence of OSN axon termini viewed in the imaging setup (right). (d) Calcium dynamics of Or35a and Or42a OSNs in a single animal in response to three odorants (10-2 odor dilution) and paraffin oil (solvent). For each stimulus, raw gray-scale fluorescent images presented at 600-ms intervals are shown at the top and false color-coded time traces represented by ΔF/F (%) (scale at right) are shown at the bottom. Odor presentation (1 s) is indicated in magenta on the gray time axis at the bottom.
Figure 2
Figure 2
Ligand tuning of larval olfactory neurons in wild-type animals. (a) Odor-response profiles of the three OSNs most sensitive to ethyl butyrate, measured at axon termini of a given OSN in the antennal lobe, against a panel of 22 odorants (10-2 odor dilution) and paraffin oil (solvent). Responses are shown as described in Figure 1d. Chemical structures and categorization by functional group of 22 odorants are at top left. Traces from n = 7–9 animals per stimulus are stacked. (b) Responses of Or35a, Or42a, and Or42b OSNs to an ethyl butyrate concentration series and paraffin oil (solvent) represented as ΔF/F (%) (scale at right). Traces from n = 6–8 animals per genotype and stimulus are stacked.
Figure 3
Figure 3
Behavioral sensitivity to ethyl butyrate in wild-type and manipulated larvae. (a) Schematic of the single odor source assay, with a 0.5 M ethyl butyrate source at position E7 on the lid of a 96-well plate used to generate a radial odor gradient. (b) Average odor concentrations in gaseous phase (μM) obtained by Fourier transform-infrared (FT-IR) spectroscopy along the length of the arena shown in (a). Odor concentrations (mean ± SEM) were measured 1–5 minutes after loading. (c) Topographic reconstruction of the single odor source gradient shown in (b). (d) Behavior of Or83b-/- larvae in the single odor source assay. Inset shows merged locomotor tracks for n = 5 animals, acquired consecutively, with the position of the ethyl butyrate source (60 mM) indicated by the black dot. Bar plots show the median relative occupancy with respect to the distance to odor source (n = 15 larvae). See Materials and methods for details on how occupancy distributions were calculated and evaluated with non-parametric tests for statistical significance. For clarity in data presentation, we have omitted the interquartile distances from this figure. (e) Odor-evoked behavior of wild-type and Or35a-, Or42a-, Or42b-, Or42a+Or42b-functional larvae in the single odor source assay for increasing source concentrations of ethyl butyrate (n = 15 larvae per genotype and stimulus) plotted as described in (d). Bins of relative occupancy that differ significantly from Or83b-/- are shaded (Wilcoxon test; corrected p < 0.0036). The first two bars of Or42a+Or42b-functional larvae tested at 240 μM are unshaded because large fluctuations around the mean make these data not significantly different from Or83b mutants.
Figure 4
Figure 4
Chemotaxis to ethyl butyrate in wild-type and manipulated larvae. (a) Schematic of the multiple odor source assay. Source concentrations (M) used to generate ethyl butyrate gradients. (b) Average odor concentrations (mean ± SEM) obtained by FT-IR for sections along the length and the width (inset) of the arena shown in (a). Odor concentrations (mean ± SEM) were measured 4–12 minutes after loading. (c) Topographic reconstruction of the multiple odor source gradient shown in (b). The odorant line is indicated by the dashed box. The arena was subdivided into three concentration zones indicated by the gray lines (Z1 = low (0–8.7 μM), Z2 = medium (8.7–24.2 μM), and Z3 = high (24.2–60 μM)). (d) Odor-evoked behavior of Or42a-functional (left), Or42b-functional (middle) and wild-type (right) larvae tested in the multiple source assay. Source concentration range is indicated at the left. Gradient cartoons are not to scale and represent the relative concentration differences between the gradients. Low-concentration gradients are indicated with open gradient symbols and high concentration gradients with filled gradient symbols. Ten merged tracks, acquired consecutively, are shown per genotype and stimulus. Percentages of time in zones Z1–Z3 are represented at the right of the tracks as boxplots (n = 30), in which the boundaries represent first and third quartiles, the 'waist' indicates the median, whiskers are 1.5 interquartile distance, and outliers are marked with gray dots. Data that differ significantly from Or83b-/- (source range: 3.75–120 mM) are shaded (Wilcoxon test; corrected p < 0.0056). (e) Quantification of the overall alignment of trajectories with the gradient (n = 30 for all genotypes, except for Or35a-functional n = 20–30). Data that differ significantly from Or83b-/- (source range: 3.75–120 mM; gray boxplot at left) are shaded (Wilcoxon test; corrected p < 1.4 × 10⁻⁴).
Figure 5
Figure 5
Odor responses of larval projection neurons. (a) Schematic for measuring functional activation of larval PNs in Or35a-, Or42a-, or Or42b-functional larvae at axon terminals in the mushroom body (blue box). Intrinsic G-CaMP fluorescence of the mushroom body, with subdomains 1–4 and sample orientation indicated (bottom). (b) Confocal image (flattened z-stack of 2 × 1.2 μm optical slices) of PN cell bodies stained to reveal G-CaMP (anti-GFP antibody, green) and Drosophila choline acetyltransferase (anti-ChAT, magenta). Scale bar = 20 μm. (c) Representative G-CaMP activity in PN terminals in mushroom body elicited by three odorants (10-2 dilution) and paraffin oil (solvent) in (left to right): Or35a-, Or42a-, and Or42b-functional larvae. Top row shows intrinsic mushroom body G-CaMP fluorescence and bottom four rows show false color-coded image of mushroom body taken 600 ms after stimulus onset, and represented as %ΔF/F (scale at the right). (d) Responses of PNs of single-functional larvae in (b) to eight odorants (10-2 dilution except as indicated) and paraffin oil (solvent) represented as false color-coded time traces (%ΔF/F; scale at bottom right). Traces from n = 11–14 animals per stimulus are stacked. Region of analysis is from major subdomain 1–4, as indicated in (a-b). (e) Responses of major subdomains 1–4 of PN axon termini in mushroom body of Or35a-, Or42a-, and Or42b-functional larvae to an ethyl butyrate concentration series and paraffin oil (solvent) represented as ΔF/F (%) (scale at right). Traces from n = 8 animals per genotype and stimulus are stacked.
Figure 6
Figure 6
Threshold response properties of larval local interneurons. (a) LN2 cells in the antennal lobe stained to reveal G-CaMP (left; anti-GFP antibody, green) and gamma-aminobutyric acid (middle; anti-GABA, magenta). Arrows in the merged image (right) indicate GABA-positive LN2 neurons. (b) Imaging LN activation at the terminal of the Or42a neuron, as marked by an Or42a-nsyb:tdTomato reporter. The leftmost panel is a merged image of intrinsic fluorescence of G-CaMP (green) and nsyb::tdTomato (magenta). The boundary of the antennal lobe is marked with a white dashed line and the Or42a glomerulus with a black dashed line. The other three panels show antennal lobe calcium responses to paraffin oil (solvent) and three odorants (10-2 dilution) taken 400 ms after stimulus onset, represented as ΔF/F (%) (scale at right). (c) Top panel: schematic for measuring functional activation of LN2 neurons in the antennal lobe (blue boxes) of wild-type, Or42a-, Or42b-, and Or42a+Or42b-functional larvae. Bottom panel: responses of LN2 neurons in larvae of indicated genotype to eight odorants (10-2 dilution except as indicated) and paraffin oil (solvent) represented as false color-coded time traces (%ΔF/F; scale at bottom right). Traces from n = 6–9 animals per stimulus are stacked. (d) Responses in LNs in larvae of indicated genotype to an ethyl butyrate concentration series and paraffin oil (solvent) represented as ΔF/F (%) (scale at right). Traces from n = 6–8 animals per genotype and stimulus are stacked.
Figure 7
Figure 7
Modulation of odor-evoked signals in the mushroom body by addition of a second functional OSN. (a) Representative G-CaMP activity in PN terminals in mushroom body elicited by three odorants (10-2 dilution except ethyl acetate, 10-4 dilution) and paraffin oil (solvent) in Or42a+Or42b-functional larvae compared to Or42a-functional larvae (all but the ethyl acetate image are reprinted from Figure 5c). Top image shows intrinsic mushroom body G-CaMP fluorescence with overlaid numbers indicating the location of subdomains in Figure 5a. Bottom four images show false color-coded image of mushroom body taken 600 ms after stimulus onset, and represented as ΔF/F (%) (scale at the right). (b) Responses of subdomain 2 to high concentrations of ethyl butyrate are decreased in Or42a+Or42b-functional larvae compared to those in Or42a-functional larvae. Responses to a dilution series of ethyl butyrate, 2-Heptanone (10-2 odor dilution), ethyl acetate (10-4 dilution), and paraffin oil are calculated as the average ΔF/F over 1 s after odor stimulus onset (mean ± SEM). Purple: Or42a-functional larvae (n = 8). Light blue: responses from Or42a+Or42b-functional larvae, n = 5 except paraffin oil (n = 6), 10-4 and 10-2 dilutions of ethyl butyrate (n = 6), 10-2 dilution of 2-Heptanone (n = 6), and 10-4 dilution of ethyl acetate (n = 6). Responses that differ significantly between the two genotypes are indicated with an asterisk (*p < 0.01, Student's t-test). (c) Schematic model of gain control in the larval olfactory system. In single-OSN-functional animals (left), low concentrations of odor cause moderate activation of the single OSN and its PN, leading to attraction to the odor source (magenta trajectory to the right). High concentrations of odor fail to activate the LNs (green) and cause strong activation of the PN and corresponding behavioral avoidance of the odor. In wild-type animals, low odor concentrations activate a single OSN and its PN, leading to odor attraction. At high odor concentration, two additional OSNs are recruited and the LN network is activated, preventing PN activity from reaching saturation and maintaining stable attraction to the odor.

Similar articles

Cited by

References

    1. Hummel T, Kobal G. Differences in human evoked potentials related to olfactory or trigeminal chemosensory activation. Electroencephalogr Clin Neurophysiol. 1992;84:84–89. doi: 10.1016/0168-5597(92)90070-R. - DOI - PubMed
    1. Wilson DA, Stevenson RJ. Learning to Smell: Olfactory Perception from Neurobiology to Behavior. Baltimore: Johns Hopkins University Press; 2006. pp. 64–75.
    1. Wachowiak M, Cohen LB, Zochowski MR. Distributed and concentration-invariant spatial representations of odorants by receptor neuron input to the turtle olfactory bulb. J Neurophysiol. 2002;87:1035–1045. - PubMed
    1. Uchida N, Mainen ZF. Odor concentration invariance by chemical ratio coding. Front Syst Neurosci. 2007;1:3. doi: 10.3389/neuro.06.003.2007. - DOI - PMC - PubMed
    1. Cleland TA, Johnson BA, Leon M, Linster C. Relational representation in the olfactory system. Proc Natl Acad Sci USA. 2007;104:1953–1958. doi: 10.1073/pnas.0608564104. - DOI - PMC - PubMed

Publication types

MeSH terms

LinkOut - more resources