

In vitro characterization of HCN channel kinetics and frequency dependence in myocytes predicts biological pacemaker functionality
- PMID: 19171659
- PMCID: PMC2678222
- DOI: 10.1113/jphysiol.2008.163444
In vitro characterization of HCN channel kinetics and frequency dependence in myocytes predicts biological pacemaker functionality
Abstract
The pacemaker current, mediated by hyperpolarization-activated cyclic nucleotide-gated (HCN) channels, contributes to the initiation and regulation of cardiac rhythm. Previous experiments creating HCN-based biological pacemakers in vivo found that an engineered HCN2/HCN1 chimeric channel (HCN212) resulted in significantly faster rates than HCN2, interrupted by 1-5 s pauses. To elucidate the mechanisms underlying the differences in HCN212 and HCN2 in vivo functionality as biological pacemakers, we studied newborn rat ventricular myocytes over-expressing either HCN2 or HCN212 channels. The HCN2- and HCN212-over-expressing myocytes manifest similar voltage dependence, current density and sensitivity to saturating cAMP concentrations, but HCN212 has faster activation/deactivation kinetics. Compared with HCN2, myocytes expressing HCN212 exhibit a faster spontaneous rate and greater incidence of irregular rhythms (i.e. periods of rapid spontaneous rate followed by pauses). To explore these rhythm differences further, we imposed consecutive pacing and found that activation kinetics of the two channels are slower at faster pacing frequencies. As a result, time-dependent HCN current flowing during diastole decreases for both constructs during a train of stimuli at a rapid frequency, with the effect more pronounced for HCN2. In addition, the slower deactivation kinetics of HCN2 contributes to more pronounced instantaneous current at a slower frequency. As a result of the frequency dependence of both instantaneous and time-dependent current, HCN2 exhibits more robust negative feedback than HCN212, contributing to the maintenance of a stable pacing rhythm. These results illustrate the benefit of screening HCN constructs in spontaneously active myocyte cultures and may provide the basis for future optimization of HCN-based biological pacemakers.
Figures
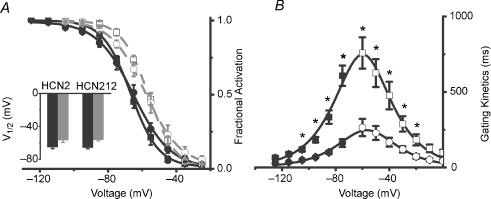
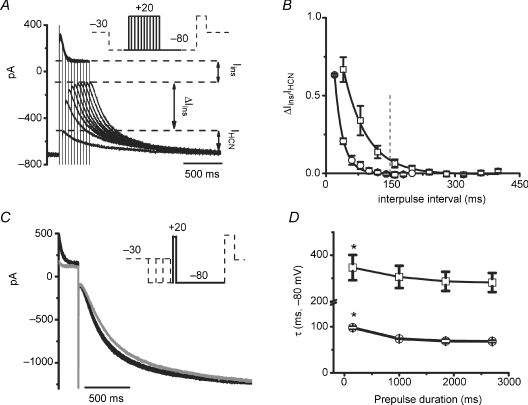
 values without (black) and with (grey) cAMP. B, voltage dependence of activation (filled symbols) and deactivation (open symbols) time constants of HCN2 (squares) and HCN212 (circles). Mean activation values were obtained from 10 cells for both HCN2 and HCN212; mean deactivation time constant values were obtained from 7 and 6 cells for HCN2 and HCN212, respectively. The curves are the fits to the equation
  . *Voltages differ by multiple comparison (P < 0.05).
Comment in
-
Putting the pacemaker channel through its paces to build a better biological pacemaker.J Physiol. 2009 Apr 1;587(Pt 7):1381-2. doi: 10.1113/jphysiol.2009.170720. J Physiol. 2009. PMID: 19336609 Free PMC article. No abstract available.
-
Fast and furious: new ways to think about, study and treat cardiac arrhythmias.J Physiol. 2009 Apr 1;587(Pt 7):1383-4. doi: 10.1113/jphysiol.2009.170936. J Physiol. 2009. PMID: 19336610 Free PMC article. No abstract available.
Similar articles
-
Putting the pacemaker channel through its paces to build a better biological pacemaker.J Physiol. 2009 Apr 1;587(Pt 7):1381-2. doi: 10.1113/jphysiol.2009.170720. J Physiol. 2009. PMID: 19336609 Free PMC article. No abstract available.
-
Associated changes in HCN2 and HCN4 transcripts and I(f) pacemaker current in myocytes.Biochim Biophys Acta. 2009 May;1788(5):1138-47. doi: 10.1016/j.bbamem.2009.02.011. Epub 2009 Feb 21. Biochim Biophys Acta. 2009. PMID: 19236845 Free PMC article.
-
Direct evidence for calcium conductance of hyperpolarization-activated cyclic nucleotide-gated channels and human native If at physiological calcium concentrations.Cardiovasc Res. 2008 Jun 1;78(3):466-75. doi: 10.1093/cvr/cvn032. Epub 2008 Feb 5. Cardiovasc Res. 2008. PMID: 18252758
-
HCN channels: structure, cellular regulation and physiological function.Cell Mol Life Sci. 2009 Feb;66(3):470-94. doi: 10.1007/s00018-008-8525-0. Cell Mol Life Sci. 2009. PMID: 18953682 Free PMC article. Review.
-
HCN channelopathies: pathophysiology in genetic epilepsy and therapeutic implications.Br J Pharmacol. 2012 Jan;165(1):49-56. doi: 10.1111/j.1476-5381.2011.01507.x. Br J Pharmacol. 2012. PMID: 21615728 Free PMC article. Review.
Cited by
-
Engineering a biological pacemaker: in vivo, in vitro and in silico models.Drug Discov Today Dis Models. 2009 Fall;6(3):93-98. doi: 10.1016/j.ddmod.2009.06.001. Drug Discov Today Dis Models. 2009. PMID: 20652091 Free PMC article.
-
Paradigm shift: new concepts for HCN4 function in cardiac pacemaking.Pflugers Arch. 2022 Jul;474(7):649-663. doi: 10.1007/s00424-022-02698-4. Epub 2022 May 13. Pflugers Arch. 2022. PMID: 35556164 Free PMC article. Review.
-
cAMP-dependent regulation of HCN4 controls the tonic entrainment process in sinoatrial node pacemaker cells.Nat Commun. 2020 Nov 3;11(1):5555. doi: 10.1038/s41467-020-19304-9. Nat Commun. 2020. PMID: 33144559 Free PMC article.
-
Reverse-engineered models reveal differential membrane properties of autonomic and cutaneous unmyelinated fibers.PLoS Comput Biol. 2024 Oct 7;20(10):e1012475. doi: 10.1371/journal.pcbi.1012475. eCollection 2024 Oct. PLoS Comput Biol. 2024. PMID: 39374306 Free PMC article.
-
Ca2+-activated adenylyl cyclase 1 introduces Ca2+-dependence to beta-adrenergic stimulation of HCN2 current.J Mol Cell Cardiol. 2012 Jun;52(6):1233-9. doi: 10.1016/j.yjmcc.2012.03.010. Epub 2012 Mar 29. J Mol Cell Cardiol. 2012. PMID: 22484253 Free PMC article.
References
-
- Accili EA, Proenza C, Baruscotti M, DiFrancesco D. From funny current to HCN channels: 20 years of excitation. News Physiol Sci. 2002;17:32–37. - PubMed
-
- Azene EM, Xue T, Marban E, Tomaselli GF, Li RA. Non-equilibrium behavior of HCN channels: insights into the role of HCN channels in native and engineered pacemakers. Cardiovasc Res. 2005;67:263–273. - PubMed
-
- Biel M, Ludwig A, Zong X, Hofmann F. Hyperpolarization-activated cation channels: a multi-gene family. Rev Physiol Biochem Pharmacol. 1999;136:165–181. - PubMed
-
- Bucchi A, Baruscotti M, Robinson RB, DiFrancesco D. Modulation of rate by autonomic agonists in SAN cells involves changes in diastolic depolarization and the pacemaker current. J Mol Cell Cardiol. 2007;43:39–48. - PubMed
Publication types
MeSH terms
Substances
Grants and funding
LinkOut - more resources
Full Text Sources
Medical
Research Materials