. 2009 Jan 26;184(2):197-203.
doi: 10.1083/jcb.200806047.

Translocation or just location? Pseudopodia affect fluorescent signals

Affiliations

Translocation or just location? Pseudopodia affect fluorescent signals

Sharon Dewitt et al. J Cell Biol. .

Abstract

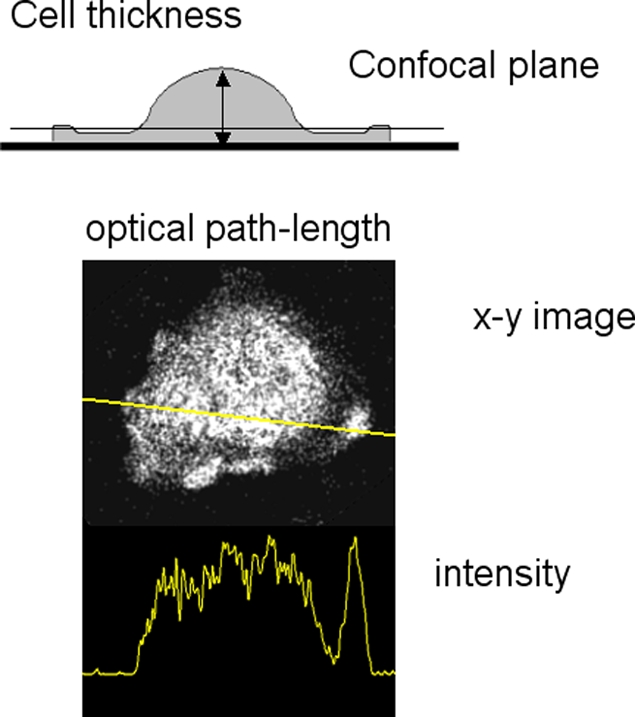
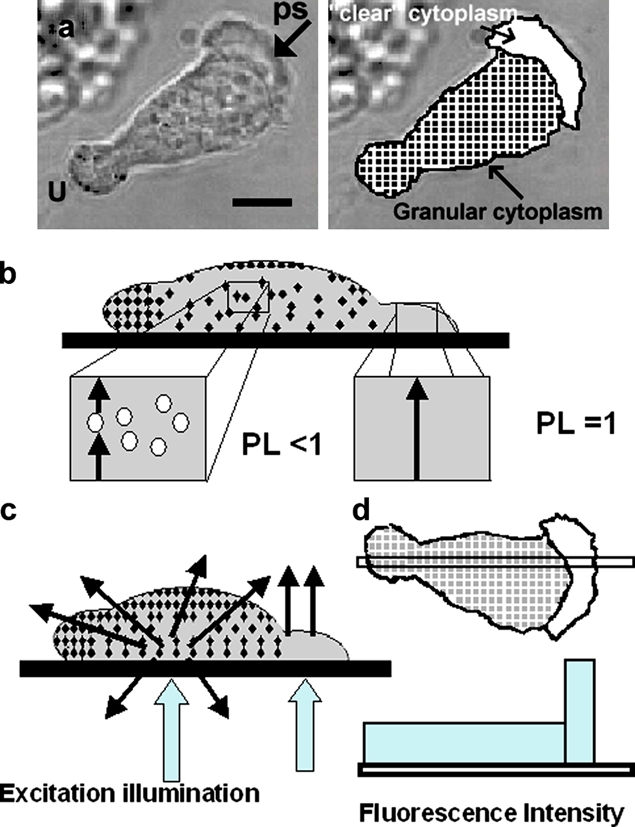
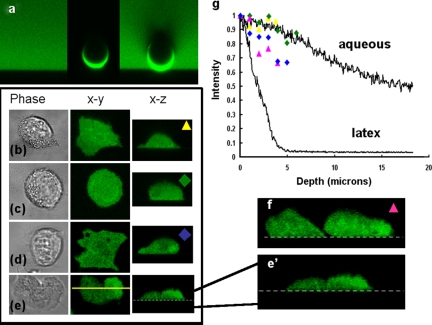
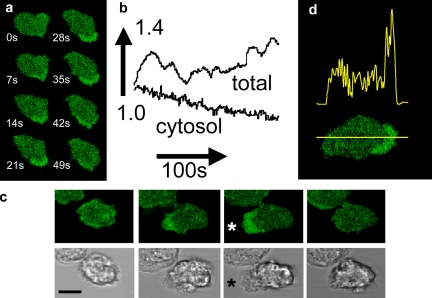
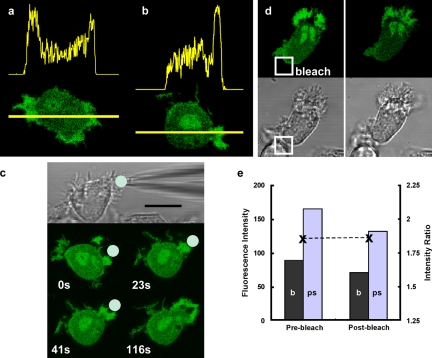
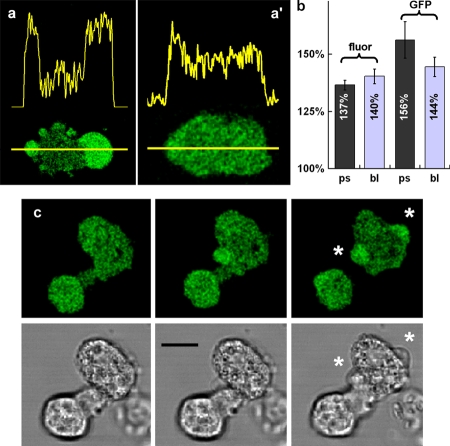
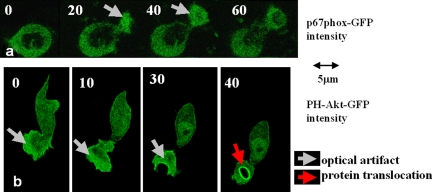
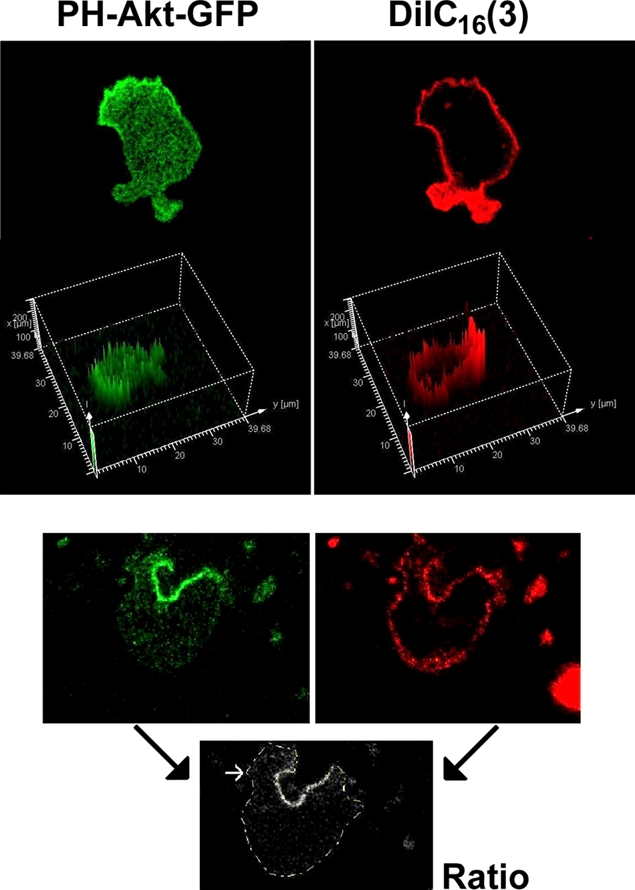
The use of fluorescent probes is one of the most powerful techniques for gaining spatial and temporal knowledge of dynamic events within living cells. Localized increases in the signal from cytosolic fluorescent protein constructs, for example, are frequently used as evidence for translocation of proteins to specific sites within the cell. However, differences in optical and geometrical properties of cytoplasm can influence the recorded intensity of the probe signal. Pseudopodia are especially problematic because their cytoplasmic properties can cause abrupt increases in fluorescent signal of both GFP and fluorescein. Investigators should therefore be cautious when interpreting fluorescence changes within a cell, as these can result from either translocation of the probe or changes in the optical properties of the milieu surrounding the probe.


Figures

Figure 1.
Figure 1.
Excitation path-length changes caused by difference in cell thickness. The top diagram shows how cell thickness varies across the cell, which has a thin skirt around it and a thicker terminal region. The position of a confocal optical section is shown which would include the thicker terminal region but not the skirt. An example of this artifact is shown below (spreading human neutrophil), together with its intensity profile. For this and other confocal images shown in this paper, the resonant scanning head of the Leica SP2 confocal microscope with a 63x oil immersion objective NA 1.32 (HCX-PL- APO) was used
Figure 2.
Figure 2.
Principle of spatial-optical effect at leading pseudopodium. (a) Phase-contrast image of polarized human neutrophils showing the leading pseudopodium of the cell marked “ps” and the uropod at the rear marked “U”. The granular and organelle-free zones are marked for clarity. (b) A “sideways” or orthogonal view of the cell showing how the amount of organelle-free cytoplasm, and hence the fluor gross concentration and optical path-length (PL) available, varies along the length of the cell. (c) The differential effect of light scattering by granular zone of cytoplasm and transmission in the clear zone are illustrated in this orthogonal view. (d) The predicted difference in efficiency of fluorescence excitation along the axis of the cell. Bar (a), 5 µm
Figure 3.
Figure 3.
Spatial attenuation of fluorescein in cytoplasm and free solution. (a) xz section as shown through fluorescein in solution (100 µM), fluorescein conjugated at a latex sphere (10-µm-diam), and the latex sphere in the fluorescein solution. (b) Fluorescein-loaded HECV cell, (c) fluorescein-loaded PC3 cell, (d) GFP-expressing dictyostelium, and (e) fluorescein-loaded human neutrophil shown as phase-contrast image, xy and xz confocal planes. An enlarged version of the xz section of a polarized human neutrophil along the line marked is shown in e′. (f) A similar xz section is shown though two other neutrophils which have not yet “flattened out“ showing the clear attenuation of fluorescence toward the top of the cells. (g) The intensity profile of the free fluorescein and latex-attached fluorescein together with data from the cells shown, using the colored symbols indicated on the images. Bar: (a) 10 µm; (b–e) 25 µm
Figure 4.
Figure 4.
Asymmetrical signals with cytoplasmic fluorescein. The dynamic nature of the fluorescence asymmetry of fluorescein is shown (a) in a time sequence of images and (b) as a graph of total cellular and cytosolic fluorescent signals. The complete time sequence is shown in Video 1 (available at http://www.jcb.org/cgi/content/full/jcb.200806047/DC1). (c) The correlation between the increased fluorescence at the leading edge and the appearance of organelle-free cytoplasm is shown in the time sequence in which the top panel shows fluorescein fluorescence and the bottom panel the corresponding phase-contrast images. Images are shown at 10-s intervals. The maximum projection of organelle-free cytoplasm is marked by an asterisk in the third image pair. (d) The typical distribution of fluorescence intensity of cytoplasmic fluorescein along the axis of a polarized human neutrophil is shown. Bars: (a) 10 µm; (c) 8 µm; (d) 5 µm.
Figure 5.
Figure 5.
Asymmetrical signals with cytoplasmic GFP. The typical distribution of fluorescence intensity of cytoplasmic GFP in human cord blood–derived neutrophils along the axis shown of a polarizing cell (a) and a cell undergoing phagocytosis (b). (c) The dynamic nature of the fluorescence asymmetry of GFP during phagocytosis is shown in a time sequence of images of a cell undergoing phagocytosis. The position of the iC3b-opsonised zymosan particle (presented with a micropipette) is indicated in the phase-contrast image and the fluorescent images below at the times indicated. The complete time course is shown in Video 2 (available at http://www.jcb.org/cgi/content/full/jcb.200806047/DC1). (d) The effect of localized photobleaching (30 s) within the white square on the GFP signal from the leading pseudopodia and cell body is shown and (e) quantified for the leading pseudopodia (ps) and cell body (b). The ratio of mean intensities in the two locations is also shown as the dotted line (e). Bars: (a and b) 5 µm; (c) 10 µm; (d) 10 µm. Human neutrophils expressing GFP were generated from cord blood as described previously (Omidvar et al., 2006).
Figure 6.
Figure 6.
Asymmetrical signals with cytoplasmic fluors during bleb formation. The typical distribution of fluorescence intensity of cytoplasmic GFP along the axis indicated of a human neutrophil (a) and a Dictyostelium induced to bleb by ionophore and high extracellular Ca2+ (a′) (13 mM). (b) The fluorescence enhancement in the blebs, marked in the histogram “bl”, was similar to that observed with organelle-free cytoplasm at the leading edge or in phagocytic pseudopodia (marked “ps”) and was seen for both GFP and fluorescein (marked “GFP” and “fluor”, respectively [n = 17, 4, 8, and 5 for each column in order]). (c) The correlation between the increased fluorescence and the appearance of cytoplasmic blebs is shown in this time sequence in which the top panel shows fluorescein fluorescence and the bottom panel the corresponding phase-contrast images. The location of two blebs are marked by asterisks in the third image pair. Bars: (a) 8 µm; (c) 10 µm. The complete data for bleb formation and localized intensity increase are shown in Video 3 (available at http://www.jcb.org/cgi/content/full/jcb.200806047/DC1).
Figure 7.
Figure 7.
Fluorescence intensity increases of GFP constructs in forming pseudopodia. The artifactual increases in fluorescent signal are evident in forming pseudopodia in neutrophilic HL60 cells expressing p67phox-GFP (a) and PH-Akt-GFP (b). The optical artifact is evident in the forming pseudopodia of these cells (gray arrows). However, this artifact can be distinguished from the genuine translocation of PH-Akt-GFP to the phagosomal membrane (red arrow). Bars, 5 µm
Figure 8.
Figure 8.
PH-Akt-GFP translocation to leading edge and phagocytic cup. (a) The localization of PH-Akt-GFP (green) and DiIC16(3) (red) in a polarized neutrophilic HL60 cell shows the specificity of PH-Akt-GFP fluorescence to the membrane at the front of the cell. (b) The distribution of PH-Akt-GFP (green) and DiIC16(3) (red) in a neutrophilic HL60 cell during phagocytosis is shown, together with a ratio image of the two signals showing the specificity of binding of PH-Akt-GFP to the phagocytic cup. Bar, 5 µm (data taken from Dewitt et al., 2006).

References

    1. Aizawa H., Fukui Y., Yahara I. 1997. Live dynamics of Dictyostelium cofilin suggests a role in remodeling actin latticework into bundles.J. Cell Sci. 110:2333–2344 - PubMed
    1. Bessis M. 1973. Living Blood Cells and their Ultrastructure Springer-Verlag, Berlin. New York: 298–323
    1. Brundage R.A., Fogarty K.E., Tuft R.A., Fay F.S. 1991. Ca2+ gradients underlying polarization and chemotaxis of eosinophils.Science. 254:703–705 - PubMed
    1. Charras G.T., Hu C.-K., Coughlin M., Mitchison T.J. 2006. Re-assembly of a contractile actin cortex in cell blebs.J. Cell Biol. 175:477–490 - PMC - PubMed
    1. Dewitt S., Hallett M.B. 2002. Cytosolic free Ca2+ changes and calpain activation are required for β2 integrin-accelerated phagocytosis by human neutrophils.J. Cell Biol. 159:181–189 - PMC - PubMed

Publication types

MeSH terms

Substances